
Figure 4.
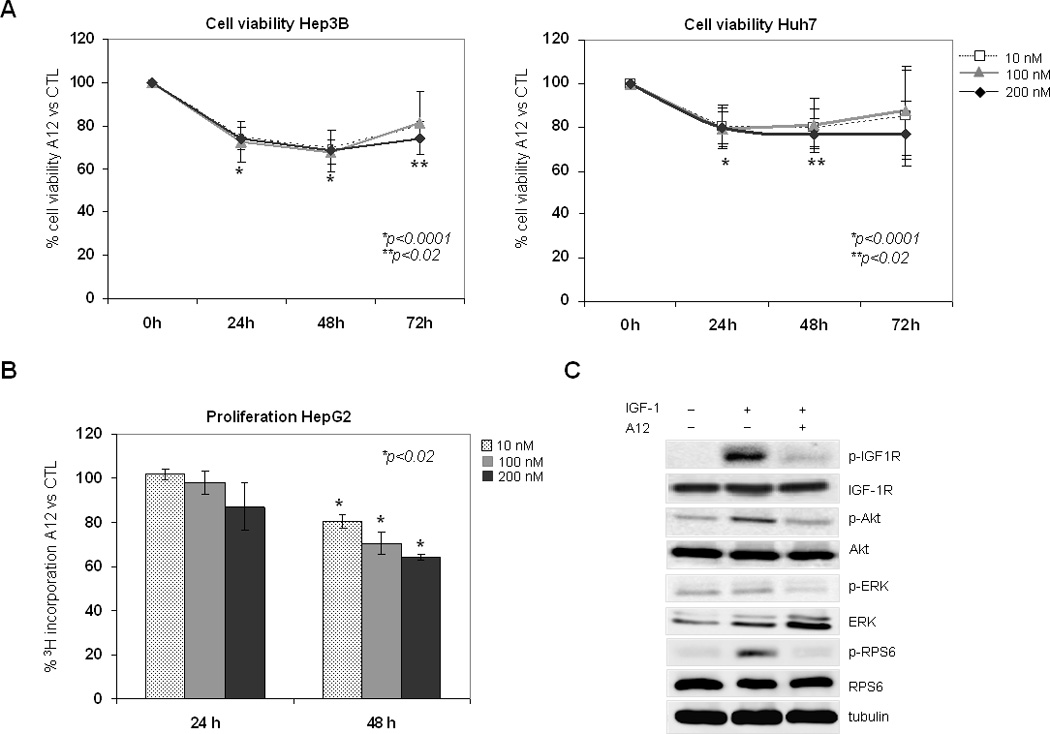
Inhibition of IGF-1R in liver cancer cell lines with the monoclonal antibody A12. (A) Cell viability was measured by MTT and the ratio of each experimental condition versus control is represented. (B) A12 effects on cell proliferation were assessed by [3H]thymidine incorporation assay. (C) Western blot from BCLC-9 lysates was performed to detect activation of IGF-1R and downstream molecules after treatment with A12 [50 nM] for 2 hours. Asterisks (*) indicate statistical significance at A12 experimental conditions compared to controls.