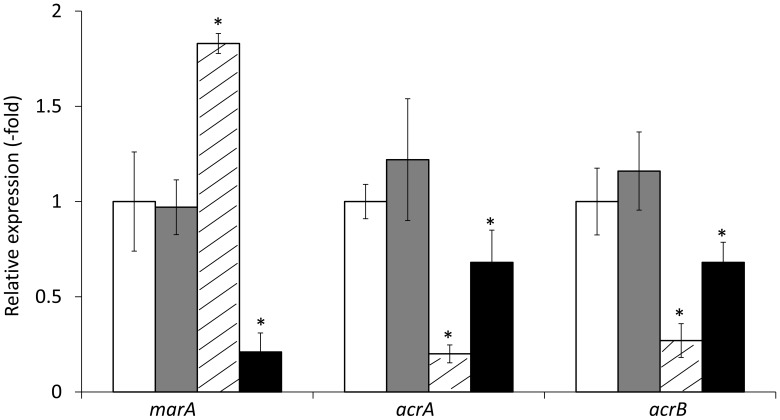
Figure 3.
mRNA expression levels of marA, acrA, and acrB in HUE1 and its acrR or marR transformants. The values indicate the expression levels of indicated genes relative to those in HUE1 (fold-changes). White, HUE1; gray, HUE1-pUC19; diagonal line, HUE1-wt-acrR (HUE1 strain transformed wild-type of acrR); black, HUE1-wt-marR (HUE1 strain transformed wild-type marR). *p < 0.05 compared to HUE1. Data represent the mean ± standard deviation values calculated from at least three independent experiments.

