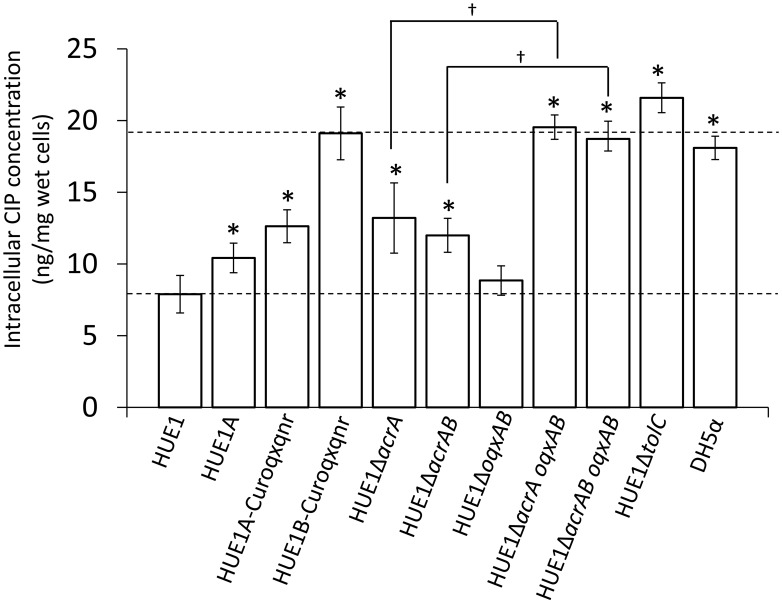
Figure 4.
Intracellular concentrations of CIP in HUE1 and its mutants obtained from plasmid curing and Red/ET recombination. Data represent the mean ± standard deviation values of the results from three independent experiments. *p < 0.05 compared to HUE1. †p < 0.05 between HUE1-ΔacrA and HUE1-ΔacrA oqxAB and between HUE1-ΔacrAB and HUE1-ΔacrAB oqxAB, respectively.

