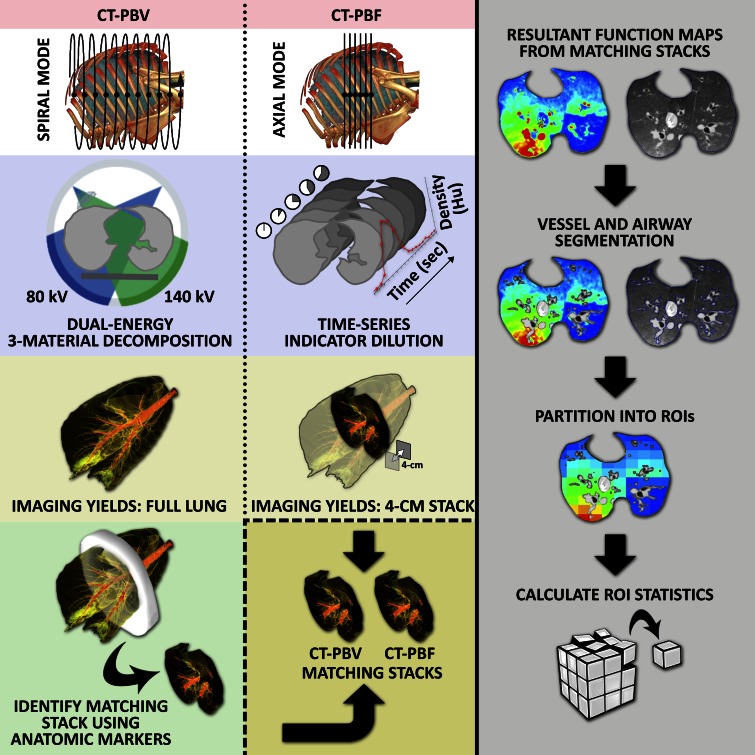
Figure 1:
Flowchart of image acquisition and analysis process. The CT-derived PBV method (left column) employs dual-energy imaging in spiral scanning mode with a three-material decomposition process to extract iodine attenuation for full lung. The CT-derived PBF method (middle column) employs an axial scanning mode to perform time-series indicator dilution, resulting in a blood flow map for a 4-cm section stack of the lung near the heart. To compare CT-derived PBF and PBV, a matching 4-cm section stack is identified and extracted from the full-lung CT-derived PBV scan. Semiautomated lung segmentation along with vessel and airway segmentation is used to limit the analysis region to lung parenchyma (right column, second row). The 4-cm section stacks are then divided into a 10 × 10 × 3 grid of blocks and the mean and CV within each block calculated.

