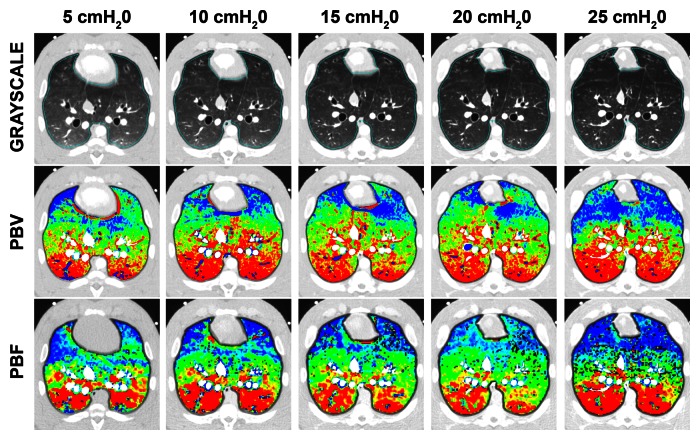
Figure 2b:
Gray-scale, PBV, and PBF CT scans. (a) Color map comparison of CT-derived PBF and PBV from pig studied with balloon occlusion model. (b) Color map comparison of CT-derived PBF and PBV from pig studied at five different lung volumes, which were used to achieve a range of pulmonary perfusion values. Color coding is the same for each condition, with low values in blue and high values in red.

