
Figure 4.
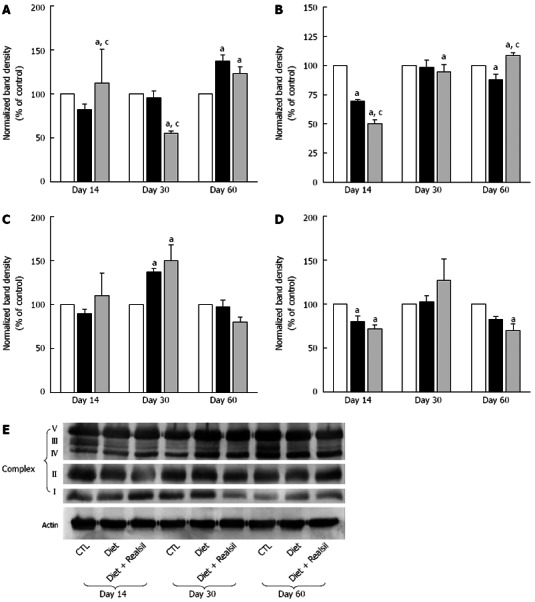
Western blotting analysis of the components of liver mitochondrial oxidative phosphorylation system in rats receiving high fat diet with (grey bar) or without (black bar) Realsil and in control (white bar) rats fed a standard chow-diet. Band density for the target protein normalized for the corresponding β-actin for A: Respiratory complex I; B: Respiratory complex II; C: Respiratory complex IV; D: Respiratory complex V; E: Picture representative of Western blotting analysis. Data are means ± SE of n = 3-4 independent experiments. aP < 0.05 vs control rats; cP < 0.05 vs untreated rats at the same time points.