
Figure 2.
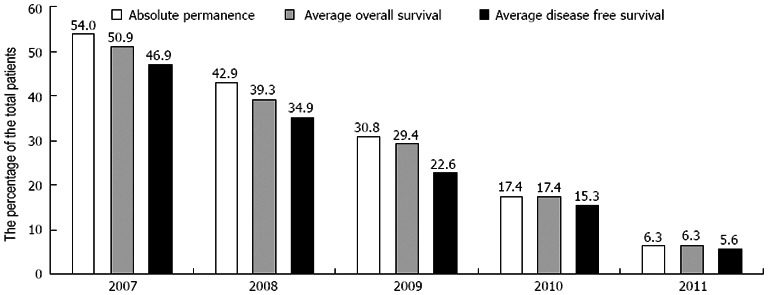
Absolute permanence (white column), overall survival (grey column), and disease-free survival (black column) comparisons. Patient data was stratified by year and is represented as a percentage of the total cohort of patients.
Official websites use .gov
A
.gov website belongs to an official
government organization in the United States.
Secure .gov websites use HTTPS
A lock (
) or https:// means you've safely
connected to the .gov website. Share sensitive
information only on official, secure websites.
Absolute permanence (white column), overall survival (grey column), and disease-free survival (black column) comparisons. Patient data was stratified by year and is represented as a percentage of the total cohort of patients.