
Figure 1.
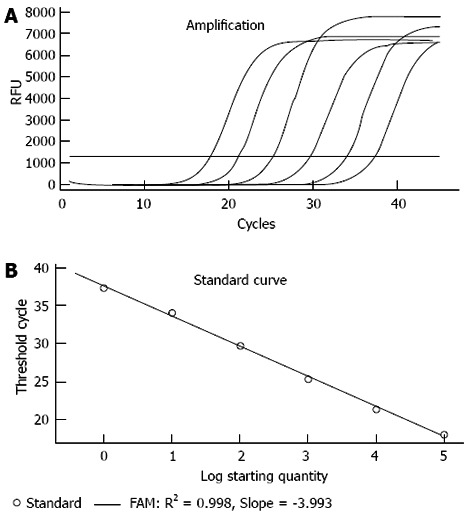
Real time polymerase chain reaction standard curve and the linear relationship between Campylobacter jejuni quantity and polymerase chain reaction cycle threshold. A: The standard curve was constructed using genomic DNA from Campylobacter jejuni isolates. Serial dilutions ranging from 100 to 106 CFU/mL of target template were subjected to real time polymerase chain reaction assay; B: The linear relationship between Log CFU/mL and threshold cycles. RFU: Relative fluorescence units.