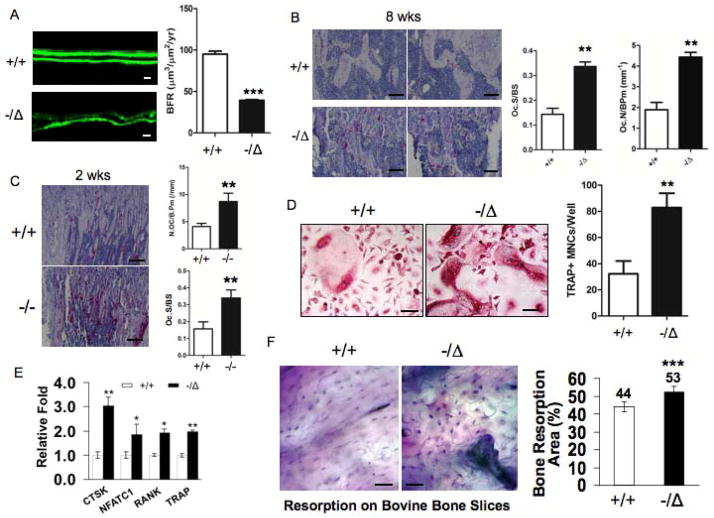
Fig. 2. ERCC1 deficiency leads to reduced bone formation and enhanced osteoclastogenesis.
(A) Calcein double-labeling showing bone formation in 8-week-old (n=4) WT (+/+) (Upper panel) and Ercc1−/Δmice (Lower panel). Scale bar, 20μm. Bone formation rate (BFR) was calculated and presented in right panel. (B) TRAP staining of tibia sections of 8-week-old (n=4) WT (+/+) (Upper panels) and Ercc1−/Δmice (Lower panels). Scale bar, 50μm. The former animals displayed a significant increase in osteoclast surface/bone surface (%) and number of osteoclasts per bone perimeter (Oc.N/B.pm) (right panel, n=4). (C) TRAP staining of tibia sections of 2-week-old WT (+/+) and Ercc1−/− mice. Scale bar, 100μm. Osteoclast surface/bone surface (%) and Oc.N/B.pm were calculated for these animals (right panel, n=4) (D) TRAP staining of pBMMs of WT (+/+) and Ercc1−/Δmice cultured in osteoclastogenic medium in vitro (n=5). Scale bar, 50μm. (E) Quantitative RT-PCR analyses for mRNA levels of osteoclastic differentiation markers in pBMMs from WT and Ercc1−/Δmice (n=3). (F) pBMMs from WT and Ercc1−/Δmice were cultured on bovine cortical bone slices in osteoclastogenic medium for 15 days and stained for toluidine blue to visualize the resorption pits, the number of which in both animals were calculated and presented in the right panel (n=3). Scale bar, 50μm. The experiments in A–C and G were performed three times independently, and representative data are shown. All values are shown as mean ± SEM. **p < 0.01.

