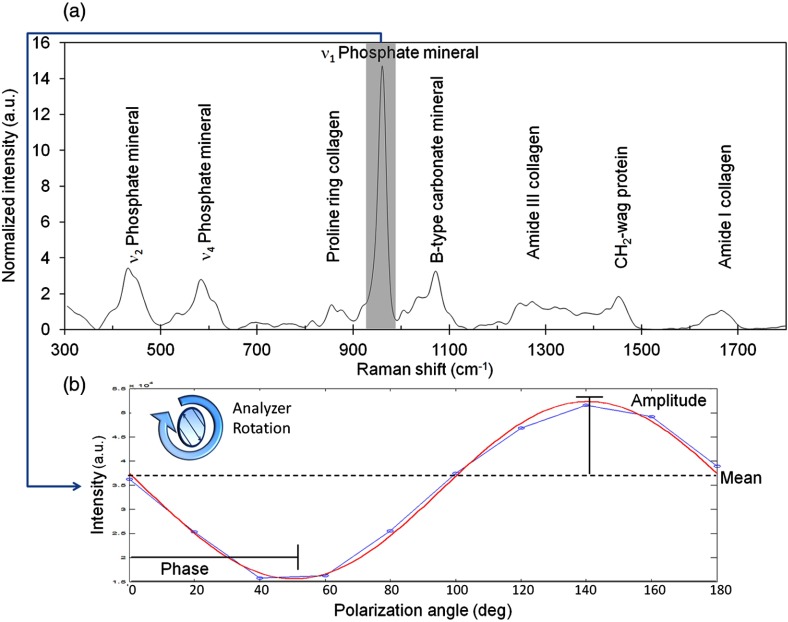
Fig. 1.
Diagram of representative labeled Raman spectrum of bone shows feature extraction. (a) Phosphate peak intensity is extracted from a wavenumber range and baselined. (b) Actual data from highly polarized osteon analysis shows ν1 Phosphate intensity for each analyzer rotation (output polarization angle). Data is then modeled to a sinusoidal fit to extract phase, amplitude, and mean intensity. Shown here for analyzer rotation, this method was also used in bone rotation experiments.

