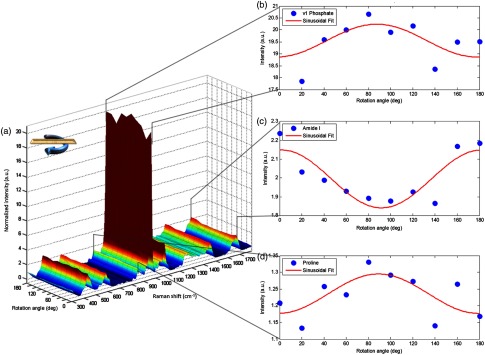
Fig. 5.

Surface plot of osteonal sample bone rotation under unaltered polarization setup indicates persistence of phase mismatch for mineral to collagen components. (a) Intensity colored surface plot shows spectral variance due to rotation angle. Cutaways show Phosphate peak intensity (b) is out of phase with Amide I (c) while in phase with Proline (d).
