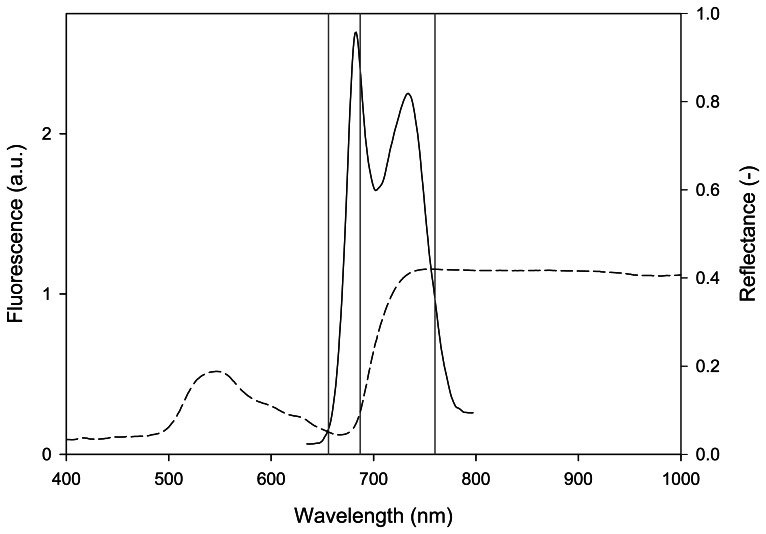
Figure 1.
Fluorescence emission spectrum of a white clover leaf excited with a tungsten halogen light source filtered with a short-pass filter blocking the light in the emission region 650-800 nm (continuous curve). Reflectance spectrum of the same leaf (dashed curve). Position of the hydrogen absorption Hα (656 nm) and oxygen absorption A (760 nm) and B (687 nm) bands (grey vertical lines).

