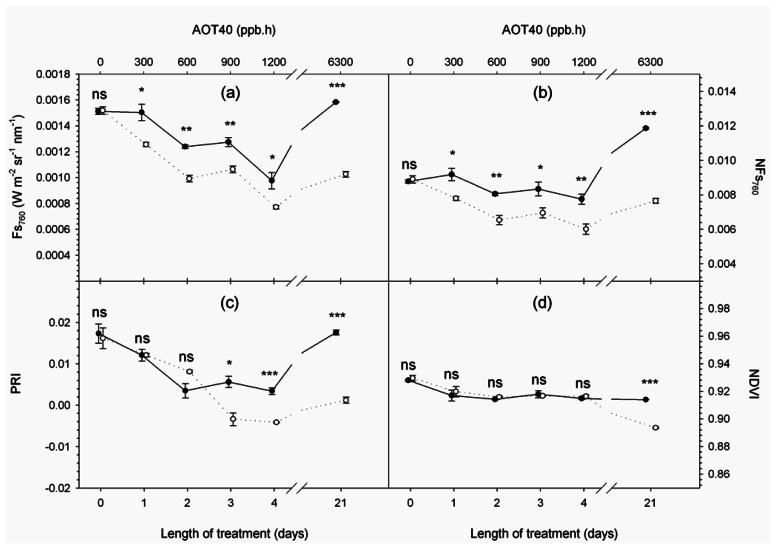
Figure 4.
Time series of spectral variables measured at 10:30 a.m. (solar time): (a) solar-induced steady-state fluorescence at 760 nm (Fs760); (b) normalized fluorescence at 760 nm (NFs760); (c) Photochemical Reflectance Index (PRI); (d) Normalized Difference Vegetation Index (NDVI). Full and empty dots refer to control and treatment samples respectively. Values represent means ± SE (n = 3). Comparison between means was performed according to Student's t-test (ns : P > 0.05; * : P ≤ 0.05; ** : P ≤ 0.01; *** : P ≤ 0.001).

