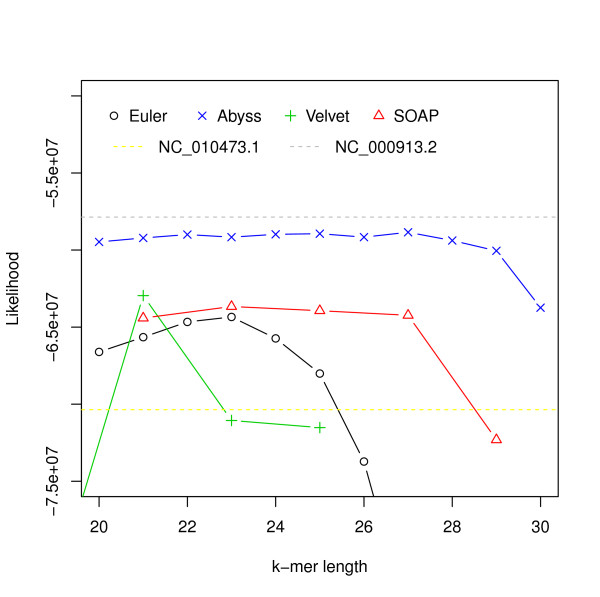
Figure 6.
Hash length vs log likelihood for E. coli data from CLC bio. Log likelihoods of assemblies of E. coli reads from CLC bio are shown on the y-axis. Assemblies are generated using different assemblers for varying k-mer length, which is shown on the x-axis. The yellow dotted line corresponds to the log likelihood of the reference provided and the gray dotted line corresponds to the log likelihood of the strain we believe the reads were generated from.

