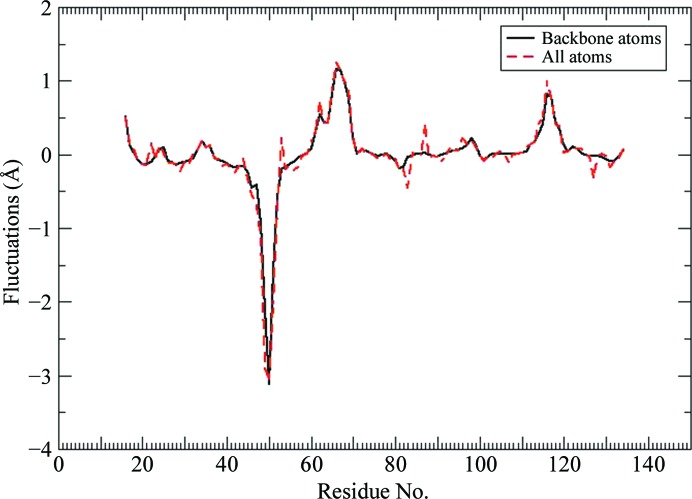
Figure 6.
Difference plot for atomic fluctuations averaged over all atoms in each residue for wild-type versus CP50/49 mutant streptavidin complexes. Positive values indicate greater mobility in the wild-type complex versus the mutant. The large negative peak observed for residues 45–53 indicates that these residues exhibit significantly increased motion in the CP50/49 mutant complex versus the wild-type complex. The positive peaks present for residues 64–69 (loop L4,5) and residues 115–122 (loop L7,8) indicate larger ranges of motion for these large flexible loops in the wild-type simulation. Large fluctuations are typically observed for these loop residues in simulations of all of the wild-type and mutant complexes that we have studied previously, and as the simulations are propagated for longer time periods the atom fluctuation differences in these loop regions decrease asymptotically to baseline. The CP50/49 mutant simulation reported here is relatively short (∼250 ns) compared with the reference wild-type simulation, so the positive peaks for loops L4,5 and L7,8 reflect the more extensive conformational sampling achieved in the longer wild-type simulation.

