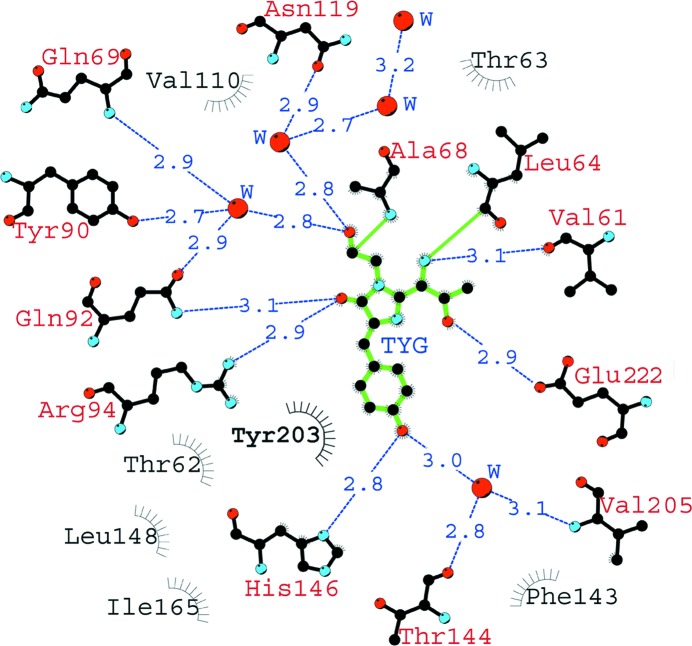
Figure 3.
A schematic diagram illustrating the nearest amino-acid environment of the chromophore in the phiYFPv structure. Hydrogen bonds (≤3.3 Å) are shown as blue dashed lines, water molecules (W) as red spheres and van der Waals contacts (≤3.9 Å) as black ‘eyelashes’. This figure was prepared using LIGPLOT/HBPLUS (McDonald & Thornton, 1994 ▶; Wallace et al., 1995 ▶).

