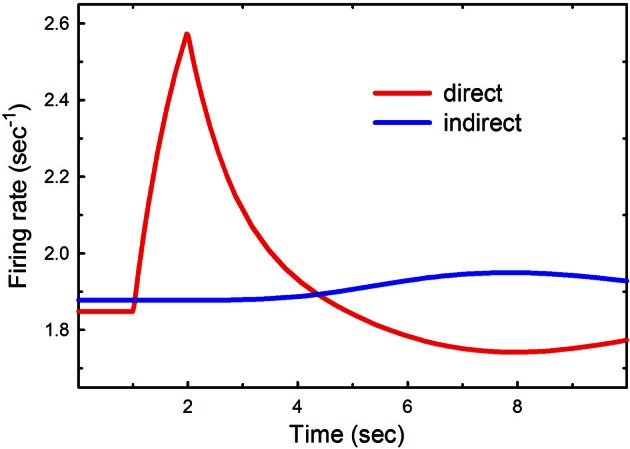
Figure 2.

Phasic cortical input to the direct pathway. The cortical input to the direct pathway, a2, was doubled between t = 1 s and t = 2 s. The red and blue curves show the firing rates as a function of time in the direct and indirect pathways, respectively.
