
Figure 1.
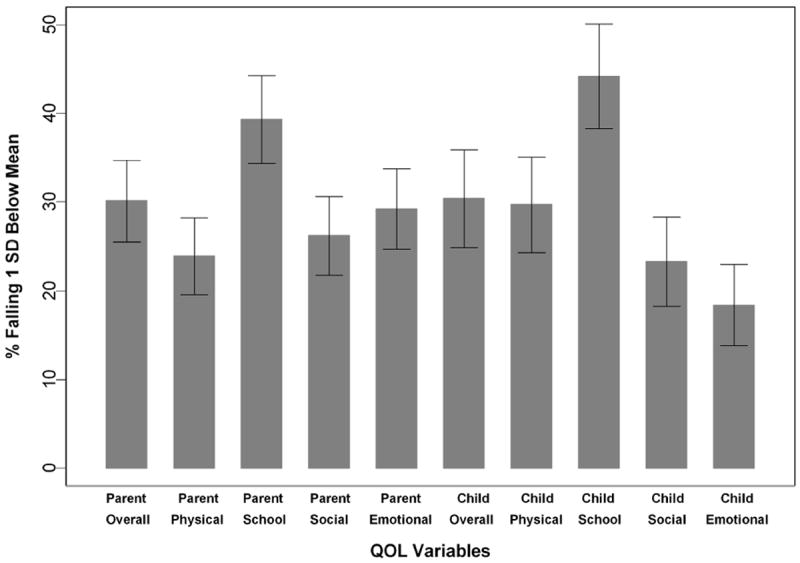
Percent of CKD group with poor quality of life (>1SD below published normative sample mean) and standard error (based on 2 SDs)
Official websites use .gov
A
.gov website belongs to an official
government organization in the United States.
Secure .gov websites use HTTPS
A lock (
) or https:// means you've safely
connected to the .gov website. Share sensitive
information only on official, secure websites.
Percent of CKD group with poor quality of life (>1SD below published normative sample mean) and standard error (based on 2 SDs)