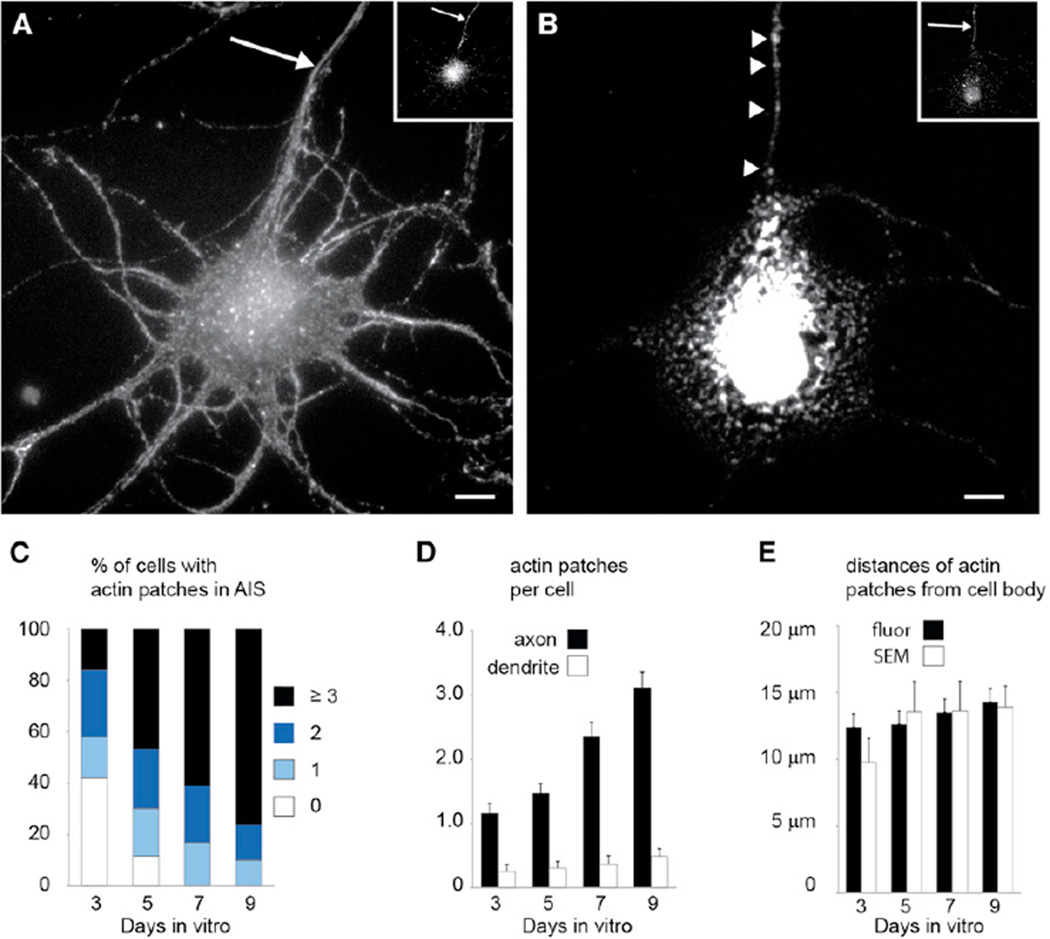
Figure 1. Actin within the AIS Is Concentrated in Patches.
(A) Cortical neuron in dissociated culture stained with phalloidin following permeabilization with 0.1% TX-100 (see Extended Experimental Procedures) shows actin distributed diffusely throughout. Inset shows the same cell stained for Ankyrin G.
(B) A cell comparable to (A) permeabilized with 1% TX-100 shows actin in discrete patches in the axon (arrowheads). Inset shows the same cell stained for Ankyrin G.
(C) Percentages of cells with different numbers of actin patches at different times in vitro. By 7 DIV, 100% of cells have at least one actin patch.
(D) The number of actin patches per cell increases from one at 3 DIV to more than three at 9 DIV in the AIS (black bars), whereas actin patches are contained in fewer than one out of two dendrites (white bars).
(E) Analysis of fluorescence images (Fluor, black bars) and SEM images (white bars) indicates that most actin patches in the AIS are found between 10 µm and 15 µm away from the cell body.
Scale bars, 5 µm. The arrows points to the axon. Error bars represent SEM.

