
FIG 3 .
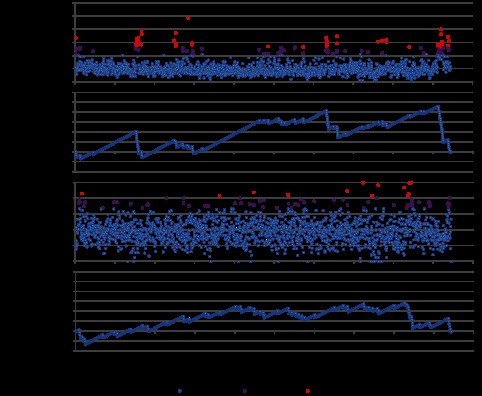
SNP distribution in the core regions. (A) SNP frequencies (percentages of polymorphic sites) of the genes in the core regions. (B) K-S statistics for genes that had higher SNP frequencies with more than two standard deviations (SD). (C) Nonsynonymous mutation frequencies of the genes in the core regions. (D) K-S statistics for genes that had higher nonsynonymous mutation frequencies with more than 2 standard deviations.