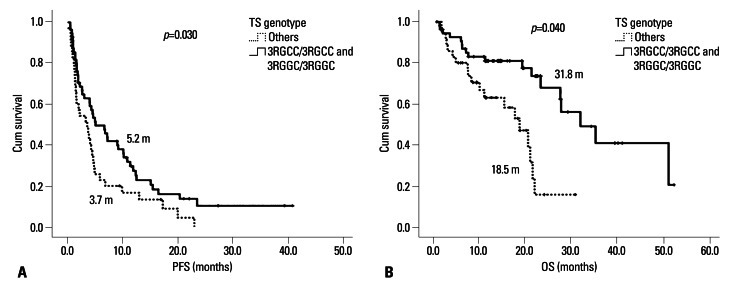
Fig. 2.
Kaplan-Meier curve estimates for patients treated with pemetrexed. Progression-free survival (PFS) and overall survival (OS) were plotted by genotype. Dotted line-2RCC/2RGC, 2RGC/3RGCC, 2RGC/3RGGC, 3RGCC/3RGGC; straight line-3RGCC/3RGCC and 3RGGC/3RGGC. (A) PFS. (B) OS. TS, thymidylate synthase.

