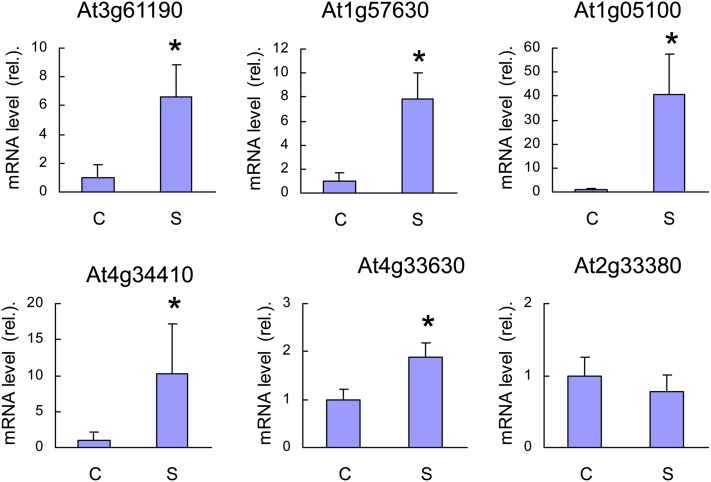
Figure 3.
qRT-PCR Analysis of the Expression Levels of 1O2-Responsive Genes in ch1 Leaves.
C, control conditions; S, stress conditions (1000 μmol photons m−2 s−1, 2 d). At3g61190 = BAP1, At1g57630 = disease resistance protein (TIR class) putative, At1g05100 = MAPKKK18, At4g34410 = AP2 domain-containing transcription factor, At4g33630 = EX1, and At2g33380 = RD20. Data are mean values of five measurements from independent RNA extractions + sd. Asterisk indicates significant difference from control at P < 0.05 (Student’s t test).
[See online article for color version of this figure.]

