Figure 4.
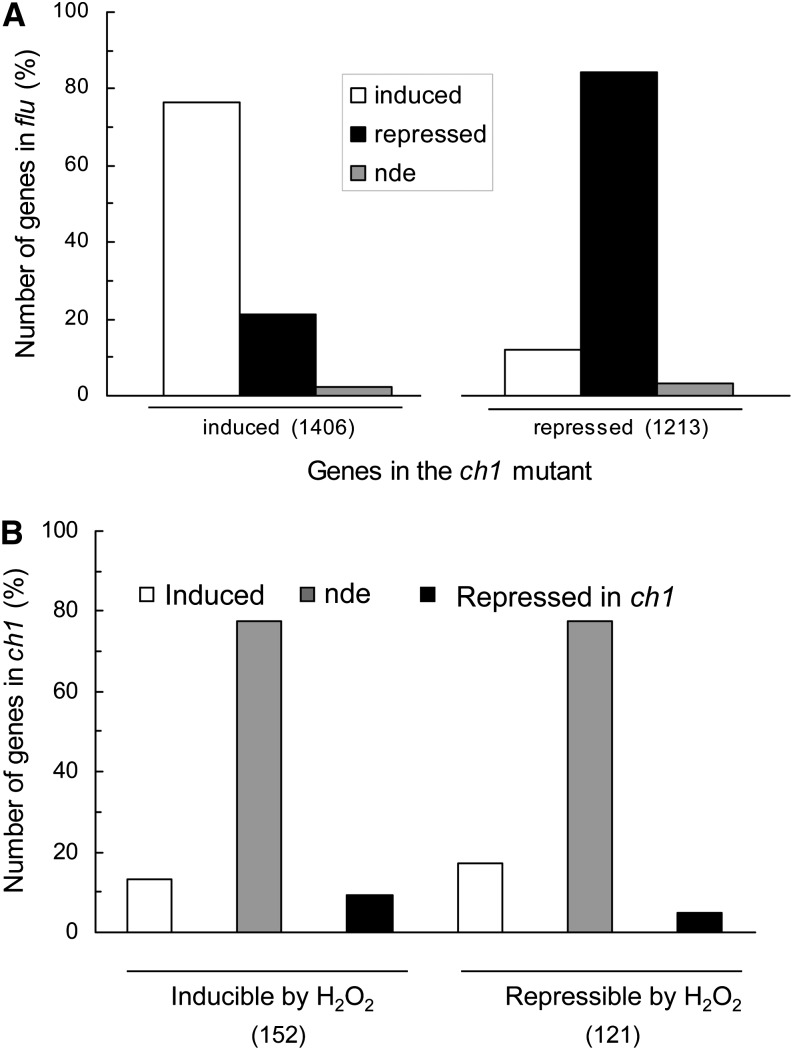
Microarray-Based Analysis of Gene Expression Changes in ch1 Mutant Leaves during High-Light Stress (1000 μmol Photons m−2 s−1, 2 d).
(A) Comparison of the gene expression profile in ch1 and flu leaves. The plot shows the percentage of genes induced or repressed in ch1 leaves during high-light stress (more than twofold change) that were induced, repressed, or not differentially expressed (compared with control conditions) in the flu Arabidopsis mutant after a dark-to-light transfer. In parentheses: number of genes induced or repressed in the ch1 mutant. This comparison is based on the microarray study of the flu mutant performed by op den Camp et al. (2003) (2-h illumination after a dark period). The latter study used the Affymetrix Gene Chip Arabidopsis ATHI Genome Array containing >22,500 probe sets representing around 24,000 genes.
(B) Percentage of genes inducible or repressible by H2O2 that were induced, repressed, or not differentially expressed (compared with control conditions) in the ch1 mutant during high-light stress. This comparison is based on Gadjev et al. (2006). The latter study used the Affymetrix Gene Chip Arabidopsis ATHI genome array. In parentheses: number of genes from the Gadjev study used for the comparison with ch1. nde, not differentially expressed.

