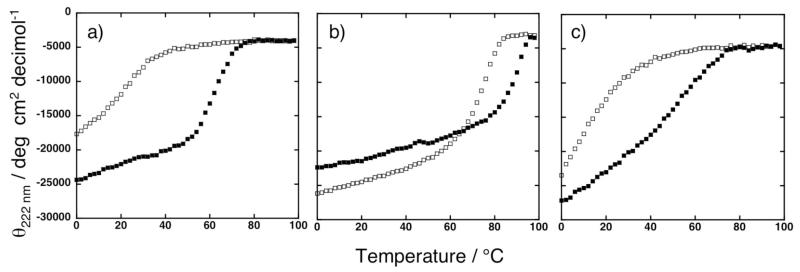
Figure 6.
Thermal denaturation curves of proteins in 20 mM sodium phosphate, pH 7.5. (a) Solid squares represent 50 μM 2PA peptide and 25 μM DPP-FeIII. Open squares represent 50 μM 2PA peptide. (b) Solid squares represent 50 μM 4PA peptide and 50 μM DPP-FeIII. Open squares represent 50 μM 4PA peptide. (c) Solid squares represent 50 μM 4PAwithout cap peptide and 50 μM DPP-FeIII. Open squares represent 50 μM 4PAwithout cap peptide. Temperature ramp from 0 to 98 °C shown.

