
Figure 6.
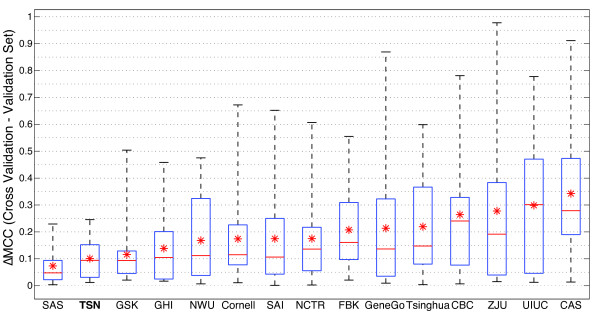
ΔMCC Results from MAQC-II data. Boxplots showing the distribution of ΔMCC values on the original data for each group, where ΔMCC = Cross Validation MCC – Validation Set MCC. This illustrates the amount of overfitting present during cross validation. The absolute value of each ΔMCC value was used in the calculations. The cross validation performed for TSN was 5-fold cross validation, repeated 10 times, as recommended by the MAQC-II consortium. Boxplots are sorted by the mean ΔMCC for each group (asterisk). All raw data is included in Additional file 3.