Figure 3.
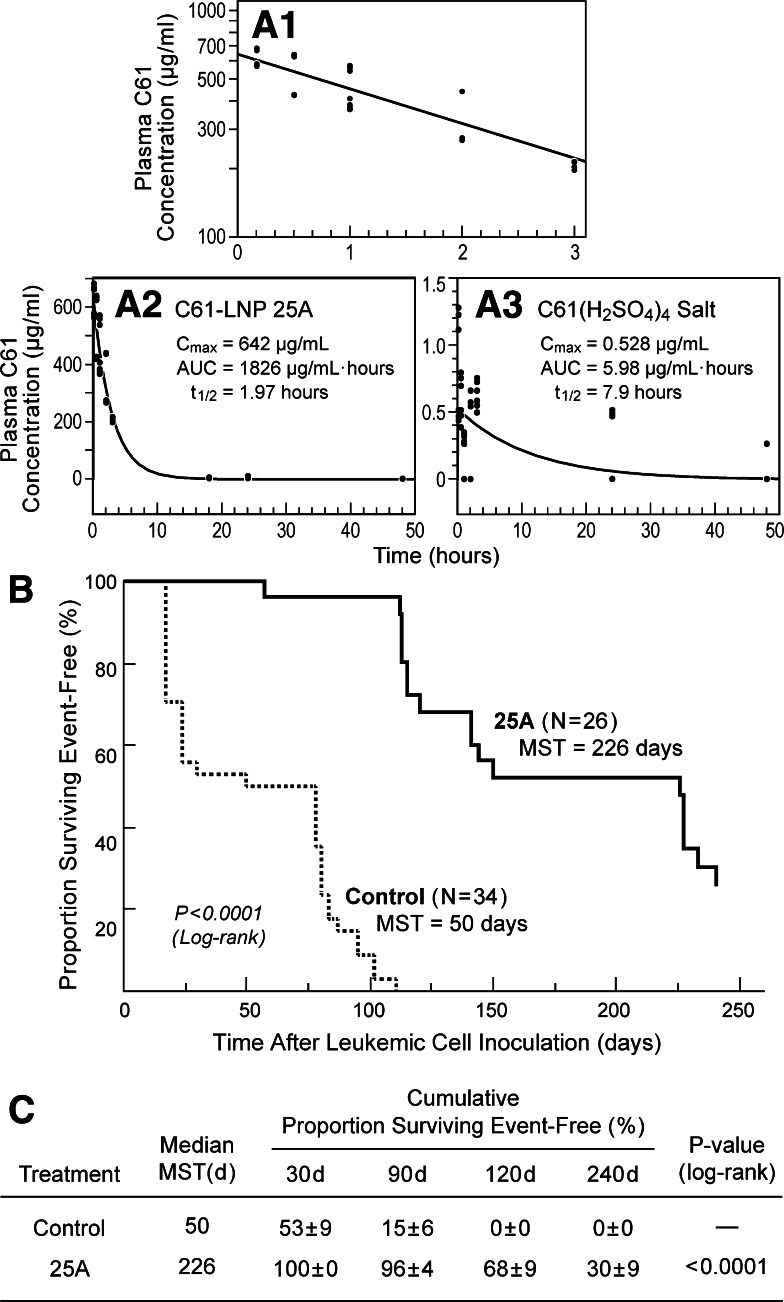
In vivo pharmacokinetics and antileukemic efficacy of 25A. (A1-A2) show the plasma concentration–time profile of the C61-LNP formulation 25A in BALB/c mice after a single IV bolus injection (dose: 80 mg/kg). (A1) depicts the time-dependent change of the plasma C61 concentration (log scale) over the first 3 hours after injection. (A2) depicts the time-dependent change of the plasma C61 concentration (linear scale) over a 48-hour time period after injection. (A3) shows the plasma concentration–time profile of C61-salt formulation in BALB/c mice after a single IV bolus injection (dose: 40 mg/kg). C61-salt was used as a control and administered as a 40-mg/kg IV bolus dose because an 80 mg/kg dose level caused seizures and sudden death. (B-C) Shown are EFS curves of NOD/SCID mice challenged with xenograft cells derived from primary LLPCs of 3 patients with B-precursor ALL. 25A treatments administered every other day for 3 days (2 cases) or 10 days (1 case) significantly improved the EFS outcome. In the control group of 34 mice that all developed fatal leukemia, the spleens measured 3.56 ± 0.09 cm (mean ± standard error [SE]) and contained 4.88 ± 0.44 × 10⁸ cells (mean ± SE). The results for the control group were very similar in each of the 3 independent experiments performed: experiment 1: N = 7, 3.14 ± 0.4 cm/3.33 ± 0.73 × 10⁸ cells; experiment 2: N = 15, 3.70 ± 0.05 cm/6.31 ± 0.79 × 10⁸ cells; experiment 3: N = 12, 3.63 ± 0.05cm/4.00 ± 0.22 × 10⁸ cells. 25A was well tolerated and did not cause any morbidity or mortality in any of the 26 NOD/SCID mice treated. Development of overt leukemia was significantly delayed by 25A treatments. Of the long-term surviving mice in the 25A-treatment group, 6 were electively euthanized on day 241 while in healthy condition. None of these 6 mice had splenomegaly, and their bone marrow, livers, kidneys, or brains did not contain any leukemic infiltrates. The average (mean ± SE) spleen size was 1.8 ± 0.1 cm, and the average spleen cell count was 7.2 ± 2.1 × 10⁶ cells per spleen. The spleen size of the combined control group was significantly larger than the spleen size of the 25A-treated mice euthanized healthy on day 241 (difference = 1.7 cm, Student t test, unequal variances, T = 16.3, degrees of freedom = 32.1, P = 5.1 × 10⁻¹⁷), and their spleen cell count was significantly higher (log10 transformed difference = 1.8, Student t test, unequal variances, T = 12.4, degrees of freedom = 11.1, P = 8.1 × 10⁻⁸). t1/2, half-life.

