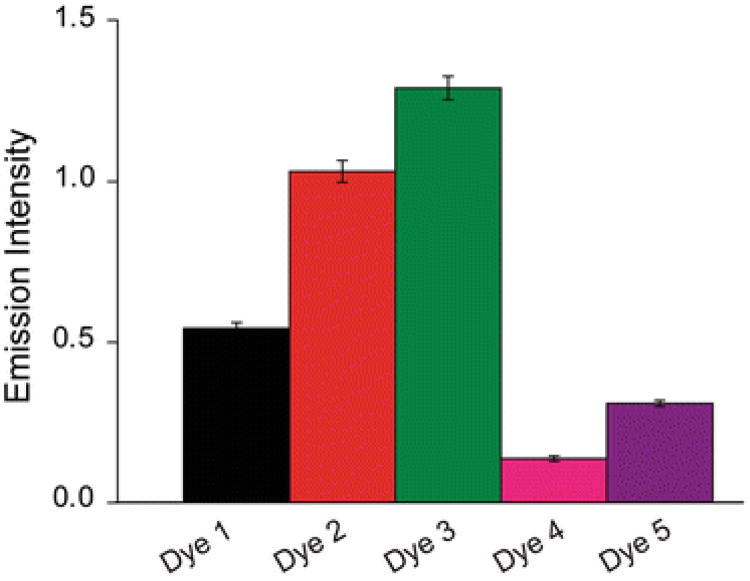
Fig. 6.
Comparison of fluorescence brightness of the five VSDs. Brightness was measured as the slope of plots relating dye concentration to normalized fluorescence emission, such as the one shown for Dye 1 in Fig. 5c. Values represent means and error bars indicate ±1 SEM (n = 7–11)

