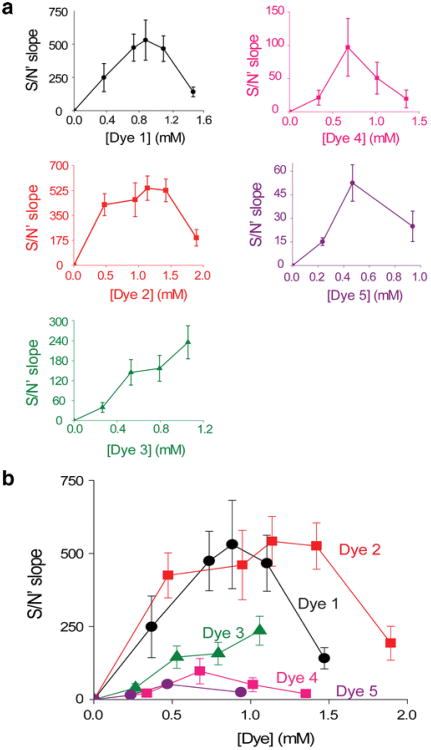
Fig. 9.
Comparison of dye S/N properties when measuring neural activity. (a) Relationship between dye concentration and S/N, measured as shown in Fig. 5e and f. Note different x- and y-axis scales for each plot. Values represent means and error bars indicate ±1 SEM. (b) Comparison of dose–response relationships for all the five dyes. Graphs shown in (b) were replotted with identical Y-axis scales and then superimposed (n = 20–42)

