. 2011 Oct 18;30(6):291–296. doi: 10.5414/NP300408

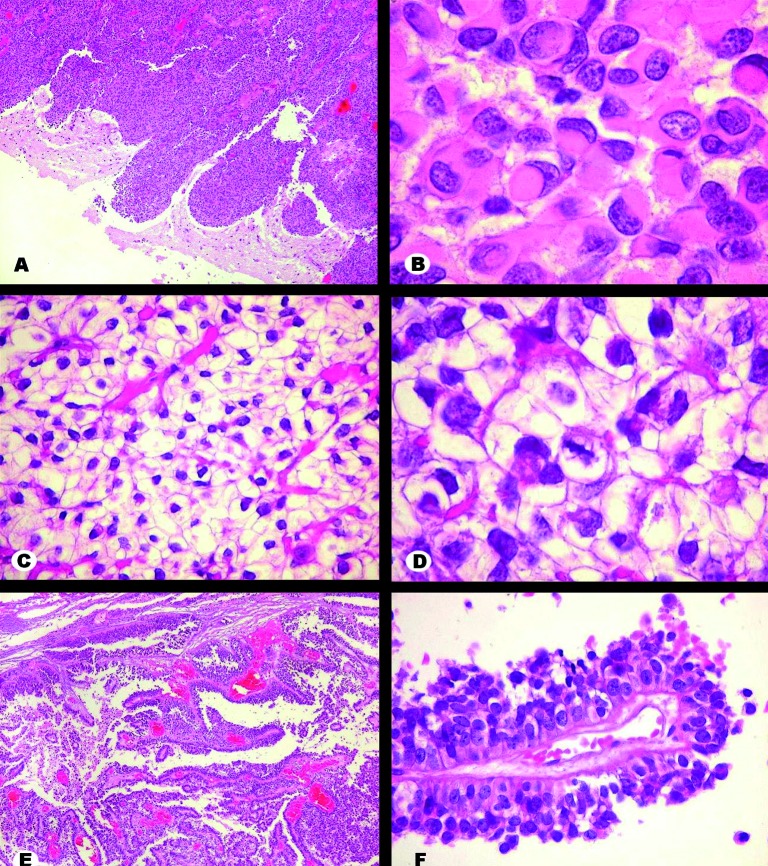
Figure 2. H&E stain. A: Interface between rhabdoid area of tumor and brain. Tumor cells invade surrounding brain as blunt projections. B: Detail of rhabdoid area. Cells show eccentric nuclei indented by a round hyaline corpuscle occupying most of the cytoplasm. C, D: Clear cell area. Cells have abundant pale cytoplasm with distinct borders and regular nuclei. Blood capillaries are thin and well distributed. A mitotic figure is seen in D, at center. E, F: Papillary component. Cells arrange themselves along branched blood vessels creating multilayered papillae. There was tendency for peripheral cells to undergo necrosis, enhancing the pseudopapillary architecture. Original magnification: A × 40, B × 400, C × 100, D × 400, E × 40, F × 100.

Figure 2.