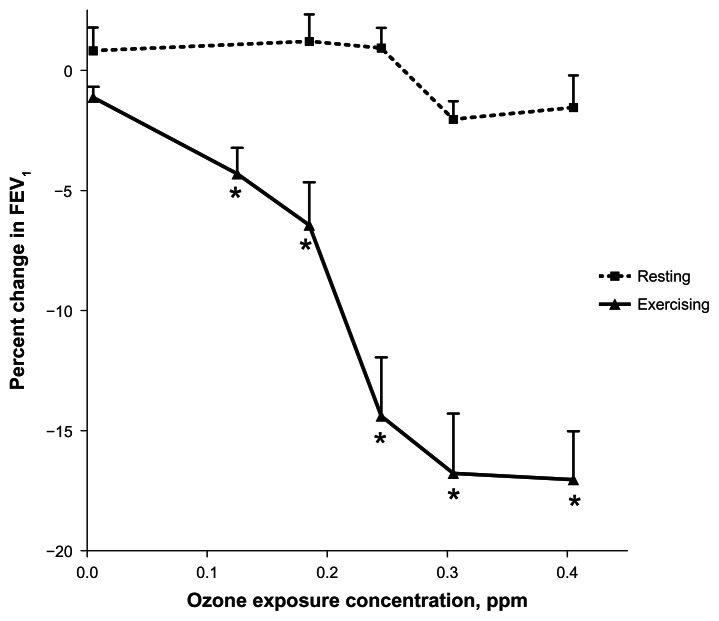
Figure 3.
Comparison of O3-induced FEV1 changes (mean ± S.E.) observed after 2 hours of exposure to various concentrations of O3 while at rest or while exercising intermittently (15 minute intervals) at a level of 65 L/min Ve.
Note: Asterisks indicate the lowest concentration of O3 exposure at which a significant change from air exposed occurred (by Williams test for nonparametric data).16

