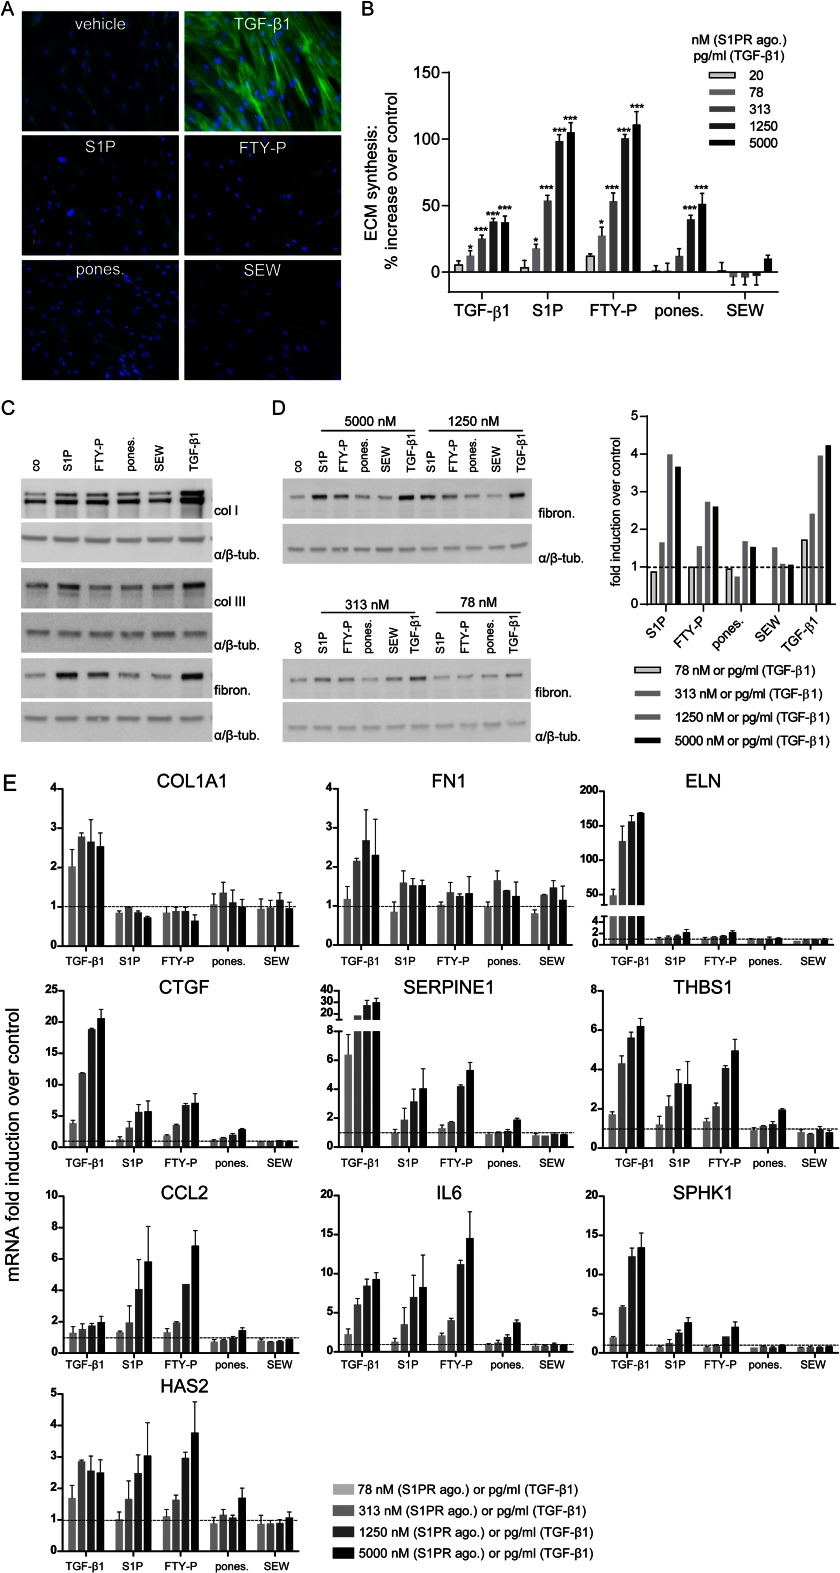
FIGURE 1.
Analysis of fibrotic responses in NHLF subjected to S1PR agonists and TGF-β1: myofibroblast transformation, ECM synthesis, and regulation of pro-fibrotic genes. A, NHLF were stimulated with TGF-β1 (5 ng/ml) or S1PR agonists (5 μm) for 72 h, and immunofluorescent staining was performed. Green, α-smooth muscle actin; blue, nuclei. B, NHLF were stimulated with TGF-β1 (20–5000 pg/ml) and S1PR agonists (20–5000 nm), and ECM synthesis was measured after 24 h with the [3H]proline incorporation assay. The data represent the means ± S.E. of three independent experiments. *, p < 0.05; ***, p < 0.001, one-way analysis of variance, Dunnett's post test. C, NHLF were stimulated with S1PR agonists (5000 nm) or TGF-β1 (5 ng/ml) for 24 h, proteins were isolated, and the expression of collagen I (col I), collagen III (col III), and fibronectin (fibron.) was analyzed by Western blotting. Equal protein amounts were confirmed by α/β-tubulin (α/β-tub.) analysis. D, NHLF were stimulated with S1PR agonists (78–5000 nm) or TGF-β1 (78–5000 pg/ml) for 24 h, proteins were isolated, and the expression of fibronectin was analyzed by Western blotting (left panel). The fibronectin expression was quantified and normalized against α/β-tubulin and expressed as fold induction over control (dashed line, right panel). The data in C and D show representative experiments (n = 3). E, qPCR of pro-fibrotic genes after stimulation of NHLF with TGF-β1 (78–5000 pg/ml) or S1PR agonists (78–5000 nm) for 8 h. Normalization was performed using B2M, HPRT1, 18 S, and PPIA, which were selected by GENORM application (43). The data are the means ± S.E. of two independent experiments. Dashed lines show the control level of gene expression.

