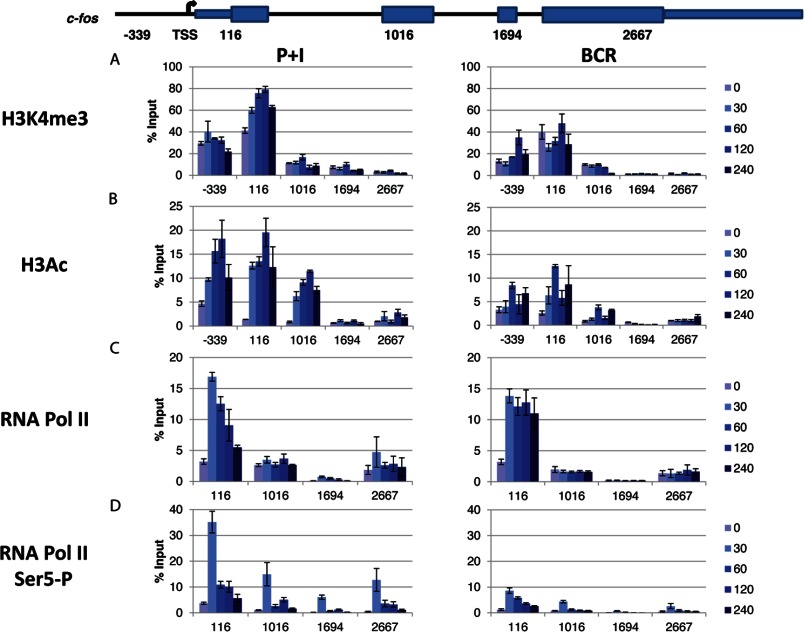
FIGURE 2.
Analyses of chromatin marks and Pol II. BAL17 cells were induced with either P+I or BCR for the indicated times in minutes. The recruitment of H3K4me3 (A) and total acetylated histone 3 (H3Ac; B) was measured by ChIP. Immunoprecipitated DNA was analyzed with primers targeting various segments of c-fos as indicated (positions are relative to the TSS depicted in the schematic). The samples were analyzed in triplicate and are reported as the mean ± S.D. of the percentage of input DNA. The data shown represent one of three comparable experiments. The levels of total Pol II (C) and Pol II phosphorylated at Ser5 of the C-terminal domain (Ser5-P; D) were measured by ChIP following stimulation with either P+I or BCR for the indicated times in minutes. Immunoprecipitated DNA was analyzed with primers targeting various segments of c-fos as indicated (positions are relative to the TSS depicted in the schematic). The samples were analyzed in triplicate, and the resulting data are reported as the mean ± S.D. of the percentage of input DNA. The data shown represent one of three comparable experiments.

