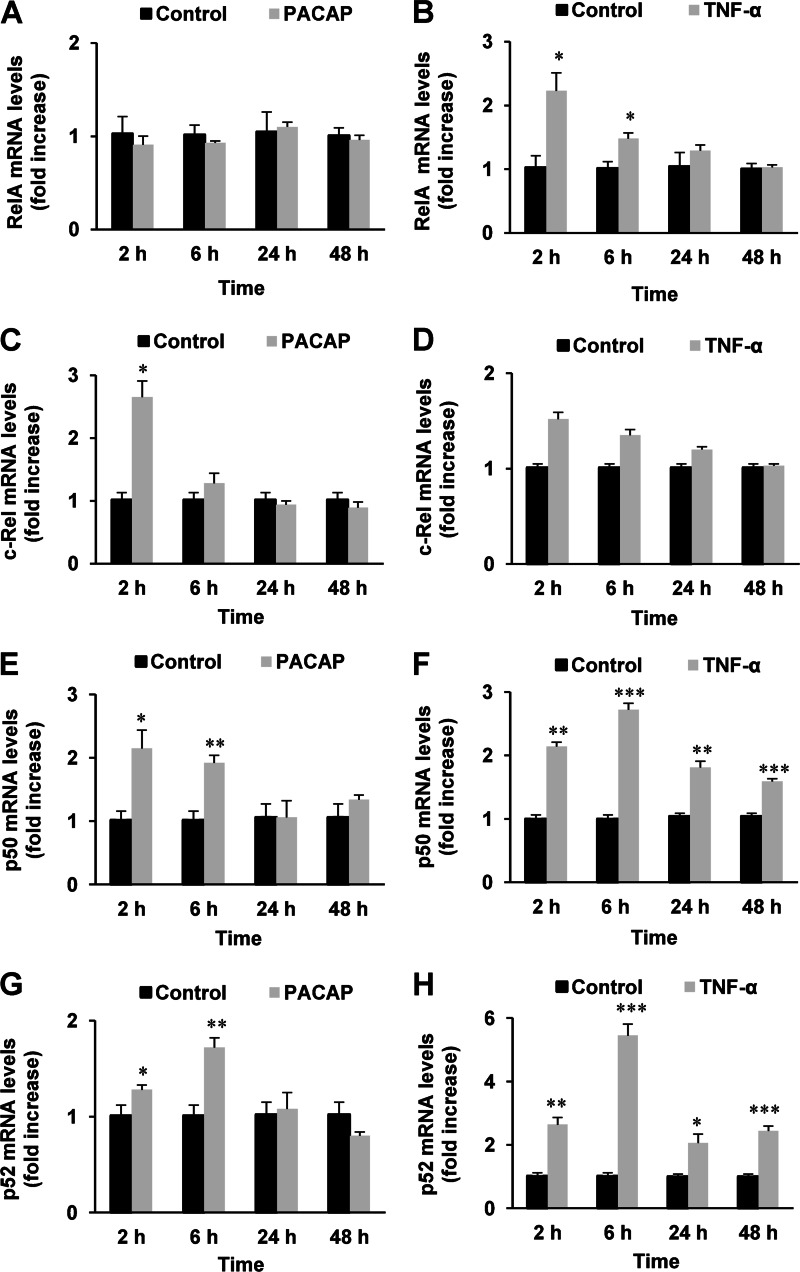
FIGURE 3.
Kinetic analysis of the effect of PACAP (100 nm) and TNF-α (10 nm) on the mRNA levels of NF-κB subunits. PC12 cells were treated with PACAP (A, C, E, and G) or TNF-α (B, D, F, and H) for the indicated times and RelA (A and B), c-Rel (C and D), p50 (E and F), and p52 (G and H) gene expression was quantified by real-time PCR. Data are expressed as mean ± S.E. (error bars) relative to control values (n = 4). *, p < 0.05; **, p < 0.01; ***, p < 0.001 (Mann-Whitney U test). The experiment was repeated two times with similar results.

