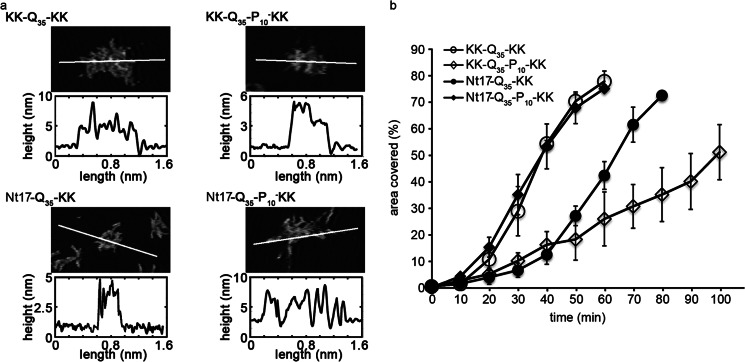
FIGURE 3.

a, zoomed in AFM images of fibril meshes are presented for KK-Q35-KK, KK-Q35-P10-KK, Nt17-Q35-KK, or Nt17-Q35-P10-KK that had aggregated in the presence of mica. The white line in each image corresponds to the height profile directly below the image. b, the area of the surface covered as a function of time demonstrates the relative aggregation rate of KK-Q35-KK, KK-Q35-P10-KK, Nt17-Q35-KK, and Nt17-Q35-P10-KK on a mica surface. Error bars represent the S.D. over 3 separate experiments for each peptide.
