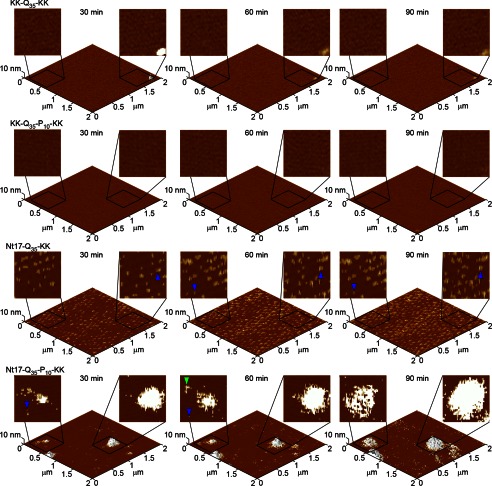
FIGURE 4.
Freshly prepared TBLE bilayers were exposed to 20 μm solutions of KK-Q35-KK, KK-Q35-P10-KK, Nt17-Q35-KK, or Nt17-Q35-P10-KK and imaged continuously in solution using atomic force microscopy. Time-lapse images of the same 2.0 × 2.0-μm region of the bilayer are presented as three-dimensional surfaces with two-dimensional insets zooming into 500 × 500-nm regions of the surface to provide morphological detail of specific aggregates. In the two-dimensional representations, blue arrows represent discrete oligomers, and green arrows represent fibrillar aggregates.

