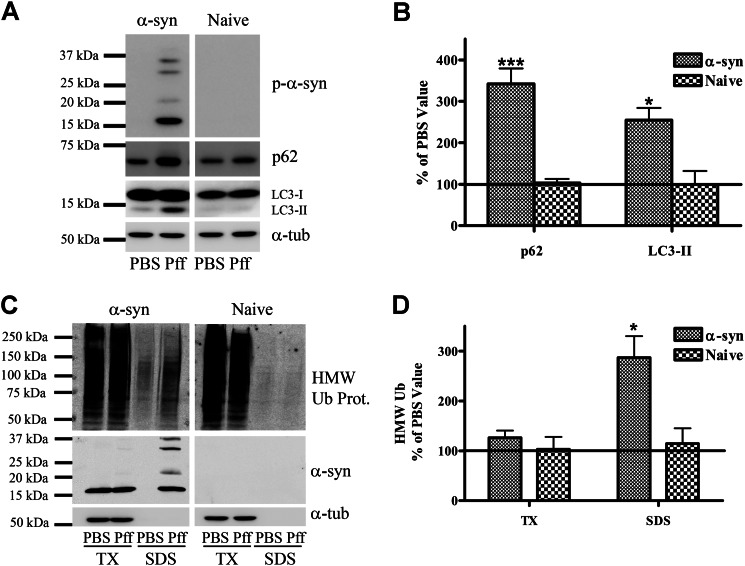
FIGURE 4.
Typical autophagy substrates accumulate in α-syn aggregate-bearing cells. A and B, 48 h after Pff transduction, α-syn and naive HEK293 cells were harvested, and proteins were extracted in SDS. A, representative IB for p-α-syn, p62, LC3, and the loading control, α-tubulin (α-tub). B, quantification of IBs (n ≥3), with protein levels in Pff-td cells expressed as a percentage of the corresponding PBS control level. C and D, 48 h after transduction, α-syn and naive HEK293 cells were extracted in Triton X-100 (TX) and then SDS. C, representative IB for HMW ubiquitin (Ub), α-syn, with α-tubulin as a loading control. D, quantification of IBs (n ≥3), with Pff-td cell levels expressed as a percentage of the corresponding PBS-td cell levels. Insoluble Ub protein levels did not increase in Pff-td naive HEK293 cells. Error bars, ±S.E. Student's paired t test was used to test for statistically significant differences. * indicates p < 0.05 and *** indicates p < 0.001, respectively.

