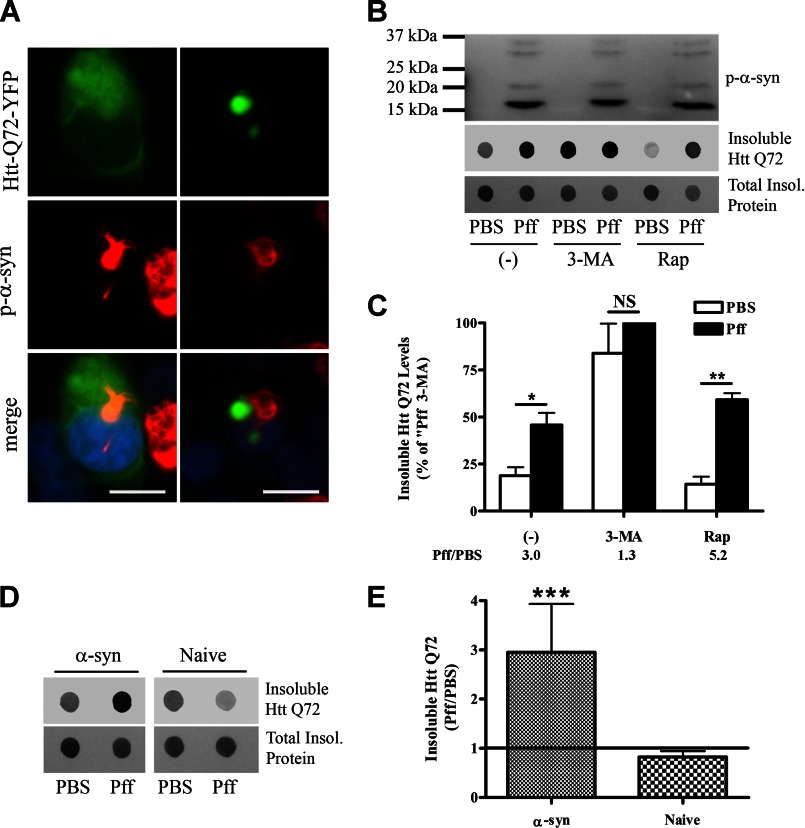
FIGURE 7.
Autophagy function is reduced in α-syn aggregate-bearing cells. A–C, 48 h after PBS or Pff transduction, HEK293 α-syn cells were transfected with YFP-tagged Htt Gln-72. 20 h after transfection, the cells were treated with 10 mm 3-MA, 0.2 μm Rap, or vehicle (−) for 24 h. A, diffuse, soluble (left) or aggregated (right) Htt Gln-72 (green) did not co-localize with p-α-syn (red) aggregates. B, representative IBs for p-α-syn and GFP (recognizes YFP tag of Htt) as well as Ponceau S total protein staining. The Htt Gln-72 within Triton X-100-insoluble cellular fractions was visualized by dot IBs. C, quantification of dot blots (n = 4). Ratio of insoluble Htt Gln-72 levels in Pff-td and PBS-td cells for each treatment condition is indicated below the graph. Pff transduction caused increased insoluble Htt Gln-72 protein levels. 3-MA treatment abolished the difference between Htt Gln-72 levels of PBS-td and Pff-td cells, suggesting that this difference in untreated cells resulted from impaired autophagy. D and E, 48 h after transduction, HEK293 α-syn or naive HEK293 cells were transfected with YFP-tagged Htt Gln-72 and 48 h after transfection were harvested for IB. D, representative IBs for GFP (insoluble Htt Gln-72) and Ponceau S (total protein staining). The Htt Gln-72 within Triton X-100-insoluble cellular fractions was visualized by dot IBs. E, quantification of dot blots (n = 4), shown as ratio of insoluble Htt Gln-72 levels of Pff-td and PBS-td cells. The significant increase in insoluble Htt Gln-72 levels observed in Pff-td α-syn HEK293 cells was absent in naive HEK293 cells. Error bars, ±S.E. Statistical significance was determined by Student's paired t test (B and E) and one-way ANOVA (D) with Tukey's post hoc analysis. NS, *, **, and *** indicate p > 0.05, p < 0.05, p < 0.01, and p < 0.001, respectively. Scale bars, 20 μm.

