FIGURE 8.
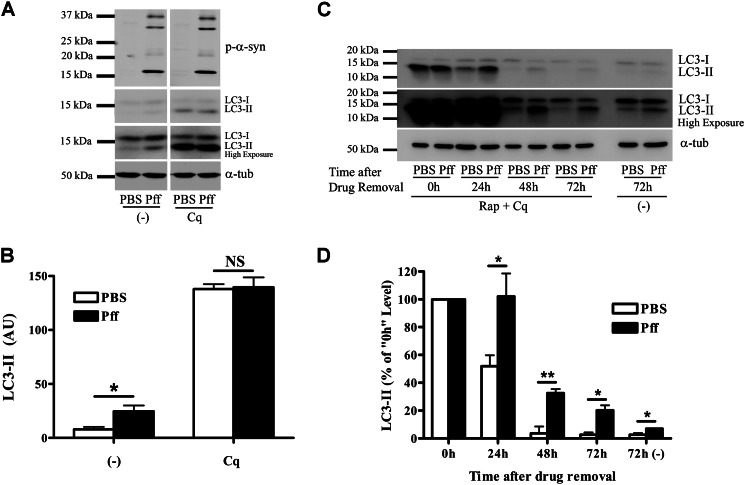
Autophagosome clearance is impaired in α-syn aggregate-bearing cells. A and B, HEK293 α-syn cells were incubated in nutrient-rich media for 4 h after Pff transduction, and the cells were treated with 100 μm of the lysosome inhibitor Cq 48 h after transduction. After 4 h of incubation with Cq, the cells were lysed in SDS buffer. A, representative IB for p-α-syn, LC3, and the loading control, α-tubulin (α-tub). B, quantification of IBs (n = 4). Pff-td and PBS-td cells showed comparable LC3-II levels upon complete inhibition of autophagosome clearance by Cq, suggesting that autophagosome clearance is impaired. C and D, HEK293 α-syn cells were incubated in nutrient-rich media 4 h after Pff transduction, and cells were treated with 0.2 μm rapamycin and 100 μm Cq 48 h after transduction. This “pulse” generated a large pool of autophagosomes in both Pff-td and PBS-td cells. After 4 h, the drugs were removed, and cells were harvested 0, 24, 48, and 72 h later. As a control, a set of cells was treated only with vehicle and were harvested 72 h after treatment. C, representative IB for LC3 and α-tubulin. D, quantification of IBs (n ≥3). Control cells rapidly cleared accumulated autophagosomes, whereas this clearance was significantly inhibited in Pff-td cells. Error bars, ±S.E. B and D, Student's t test was used to test for statistically significant differences. NS, *, and ** indicate p > 0.05, p < 0.05, and p < 0.01, respectively.

