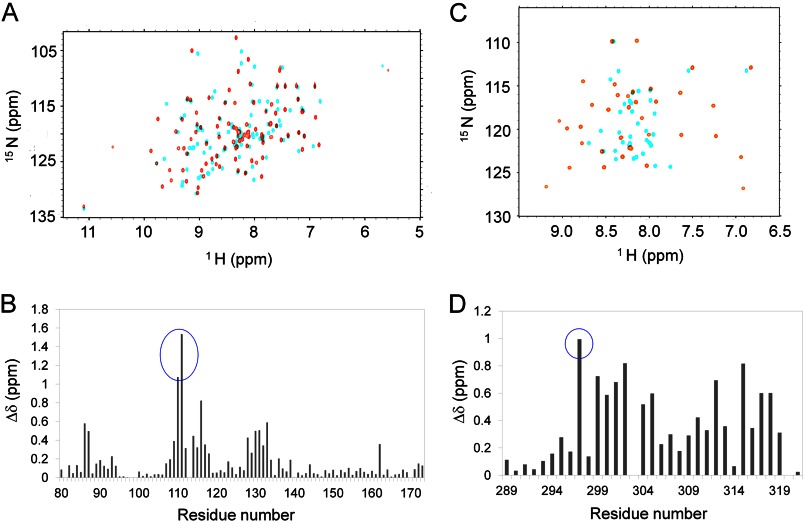
FIGURE 7.
Chemical shift perturbation experiments of [15N]Csk-SH2 or [15N]Cbp5 in the complex. Δδ indicates the weighted chemical shift deviation that was calculated according to the following equation: Δδ = ((ΔδH)2/2 + (ΔδN/5)2/2)1/2, where ΔδH and ΔδN indicate the chemical shift changes of the amide proton and nitrogen, respectively. A, overlay of the two-dimensional 1H-15N HSQC spectra of [15N]Csk-SH2 with (orange) and without (cyan) unlabeled Cbp5. B, chemical shift differences of the two spectra are plotted against the residue number. The peaks that showed >1.0 ppm changes are highlighted with a blue circle. C, overlay of the two-dimensional 1H-15N HSQC spectra of [15N]Cbp5 with (orange) and without (cyan) unlabeled Csk-SH2. D, chemical shift differences of the two spectra are plotted against the residue number. The peak that showed ∼1.0 ppm change is highlighted with a blue circle.

