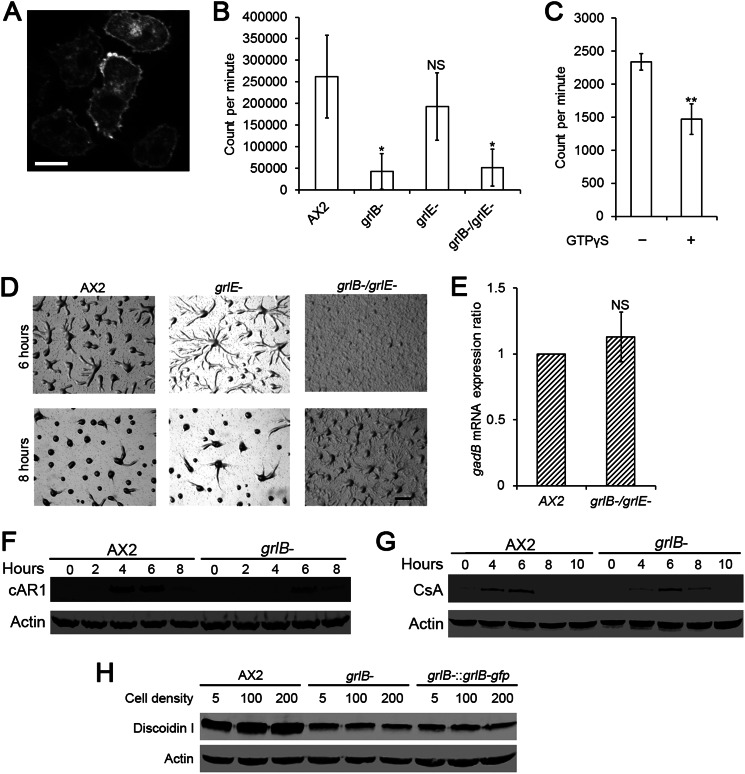
FIGURE 6.
GABA binding in vegetative cells and early gene expression in grlB- cells. A, C-terminal GFP tagged GrlB was expressed in grlB− cells. Cells from HL5 were washed with DB and plated in a glass chamber filled with DB before photographed. Bar, 5 μm. B, specific [3H]GABA binding to whole vegetative cells was shown as radioactivity (Count per minute) per 5 × 10⁶ cells. Values are means ± S.D. NS, non-significant; *, p < 0.05; **, p < 0.01. One-way ANOVA was used. C, specific [3H]GABA binding to vegetative cell membrane fraction was shown as radioactivity (count per minute) per membrane fraction from 5 × 10⁷ cells. Values are means ± S.D. **, p < 0.01. One-way ANOVA was used. D, 5 × 10⁶ vegetative cells were washed with DB twice and plated on a non-nutrient DB-agarose plates. Images were taken at indicated hours. Bar, 1 mm. E, qPCR analysis showing gadB mRNA expression change in axenic grlB−/grlE− cells. gadB transcript level in wild-type AX2 cells was normalized to 1. Ratios are means ± S.D., NS, non-significant. One-way ANOVA was used. For F and G, 5 × 10⁶ vegetative cells were developed on DB-agarose. At indicated hours, cells were collected and lysed for Western blotting. Actin was used as the loading control. H, 1 × 10⁴ cells were shaken in HL5 medium at 175 rpm, 22 °C. At indicated cell densities (×105 cells/ml), an equal amount of cells was collected and lysed for Western blotting.

