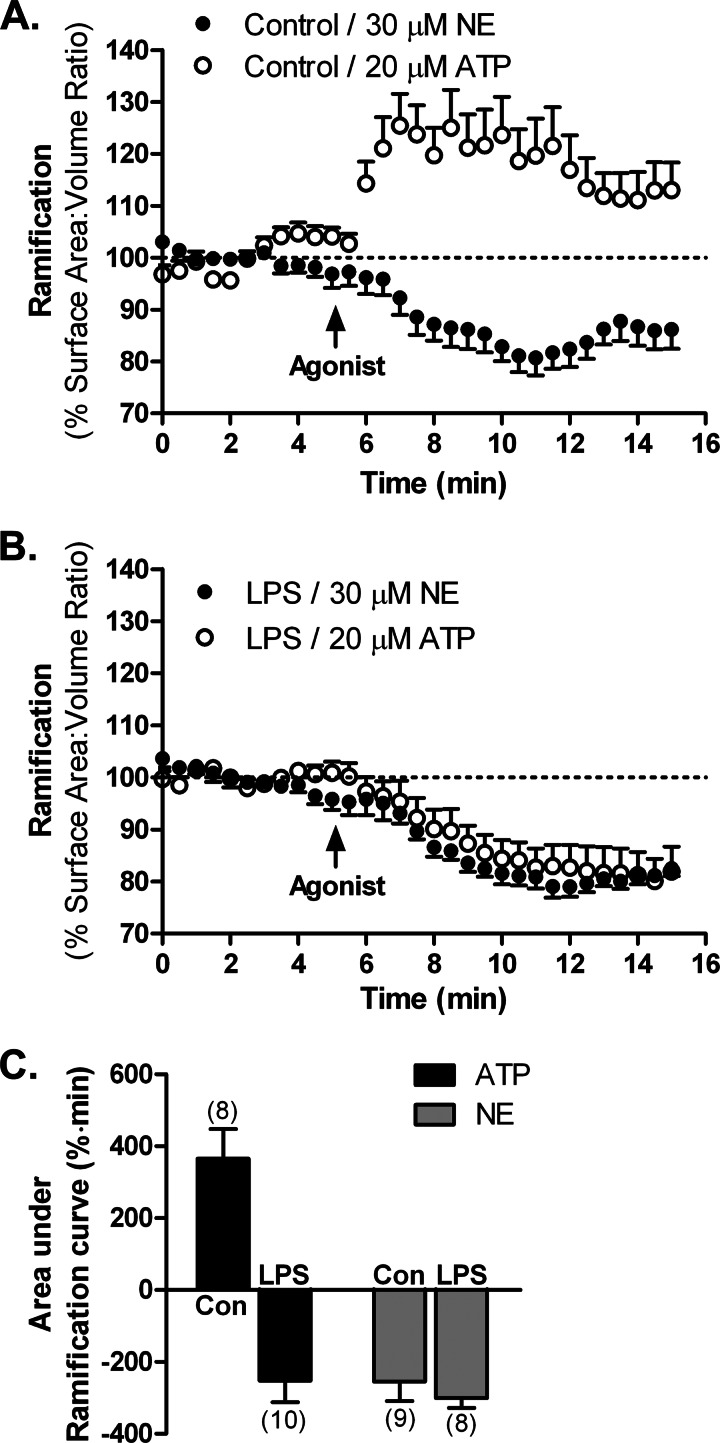
FIGURE 5.
Control of microglial process dynamics by adrenergic receptors in vitro. Three-dimensional representations of primary actin-eGFP microglia plated in Matrigel were used to calculate cell ramification as surface area-to-volume ratios at each time point. HBSS-treated (control (Con); A) or LPS-activated microglia (100 ng/ml for 24 h; B) were treated with either 20 μm ATP or 30 μm NE. C, a comparison of the effects of NE and ATP by calculating the area under the ramification curves. The number of cells for each treatment is shown in parentheses. Error bars, S.E.

