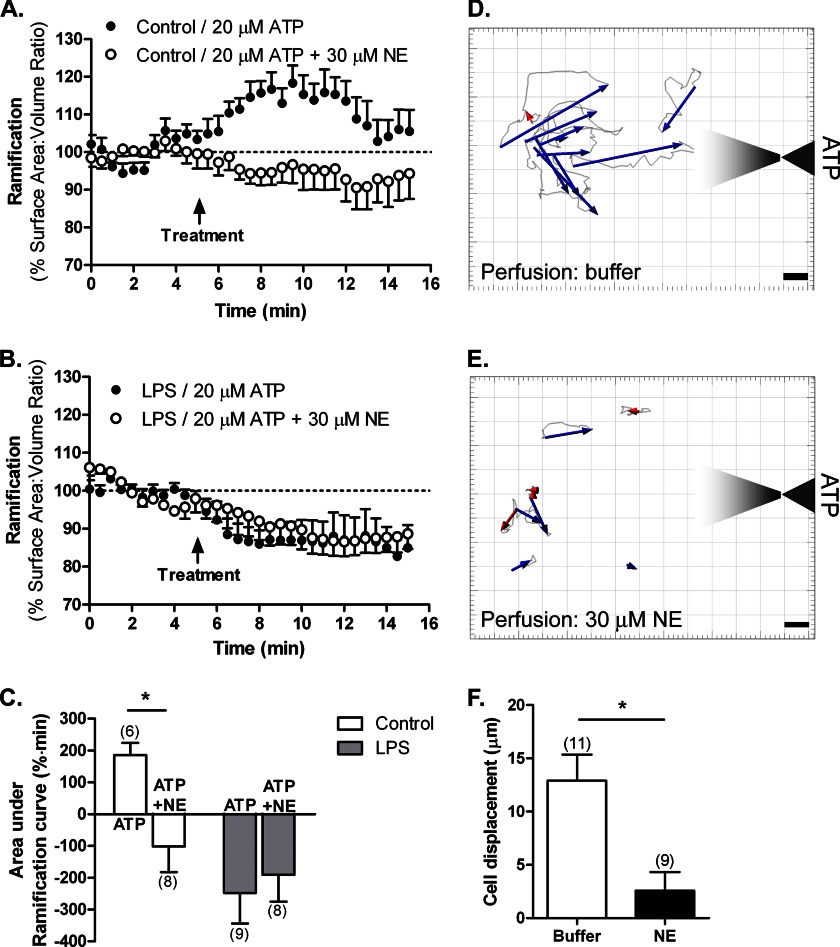
FIGURE 7.
Interaction between purinergic and adrenergic signaling in regulating microglial motility in vitro. Primary actin-eGFP microglia were imaged in Matrigel to calculate cell ramification as surface area-to-volume ratios as described. A–C, HBSS-treated (control; A) or LPS-activated microglia (100 ng/ml for 24 h; B) were treated with either 20 μm ATP or 20 μm ATP + 30 μm NE. C, quantification of cell ramification with the number of cells for each treatment shown in parentheses. Statistical analysis was performed using two-way ANOVA and Bonferroni's post hoc test compared with ATP-treated cells. *, p < 0.05. D–F, migration of primary actin-eGFP microglia to ATP released from a micropipette. The cells were perfused with either imaging buffer (D) or 30 μm NE (E). Paths of cell bodies were tracked with Bitplane Imaris and are shown in light gray; overall displacements are represented by blue (movement to pipette) or red (movement away) arrows. Scale bars, 5 μm. F, movement was quantified by measuring the magnitude of the vector displacement for each cell with positive displacement being movement toward the pipette. The number of cells for each treatment is shown in parentheses. Error bars, S.E. Statistical analysis was performed using Student's t test. *, p < 0.05.

