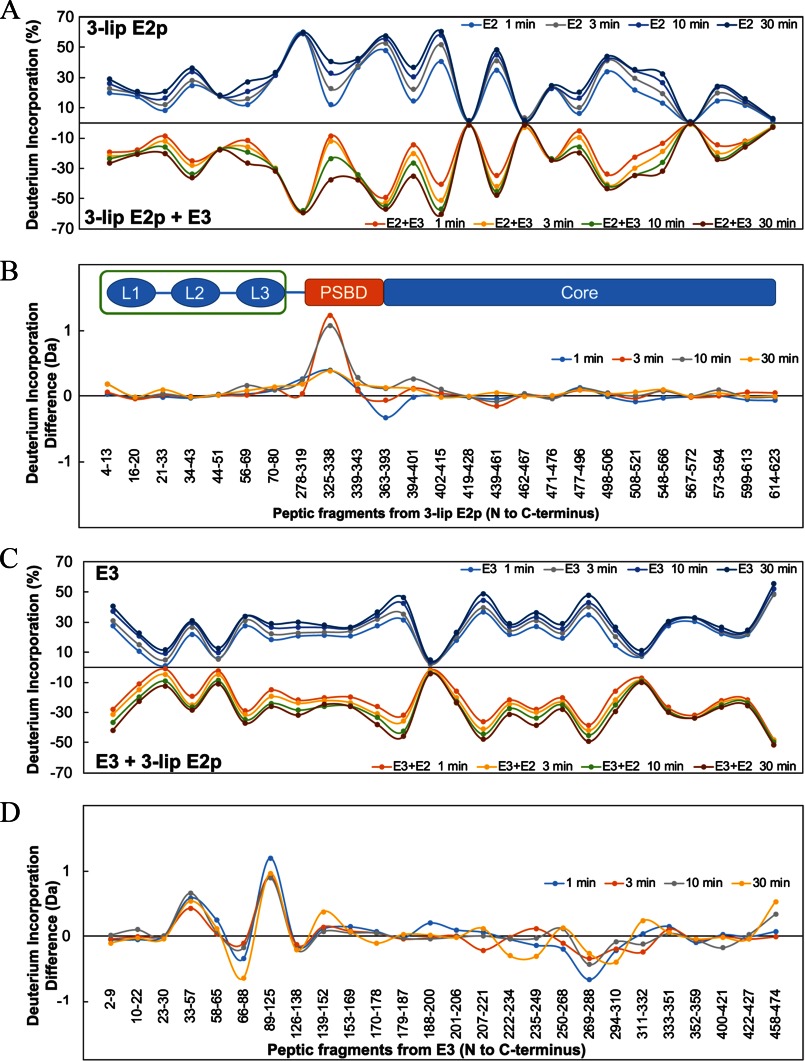
FIGURE 5.
HDX-MS analysis of 3-lip E2p and E3 in the absence and presence of the other component. A, butterfly plot representing average relative deuterium incorporation percentage (y axis) (deuterons exchanged/maximum exchangeable amides × 100%) of peptic fragments from 3-lip E2p (x axis, listed from N to C terminus) in the absence of E3 (top) versus in the presence of E3 (bottom) based on three independent experiments. B, difference plot showing deuterium incorporation changes of peptic fragments of 3-lip E2p in the absence and presence of E3 (deuterons exchanged in the absence of E3 minus deuterons exchanged in the presence of E3). C, butterfly plot representing average relative deuterium incorporation percentage (y axis) (deuterons exchanged/maximum exchangeable amides × 100%) of peptic fragments from E3 (x axis, listed from N to C terminus) in the absence of 3-lip E2p (top) versus in the presence of 3-lip E2p (bottom) based on three independent replicates. D, difference plot showing deuterium incorporation changes of peptic fragments of E3 in absence and presence of 3-lip E2p (deuterons exchanged in the absence of 3-lip E2p minus deuterons exchanged in presence of 3-lip E2p).

