
FIGURE 7.
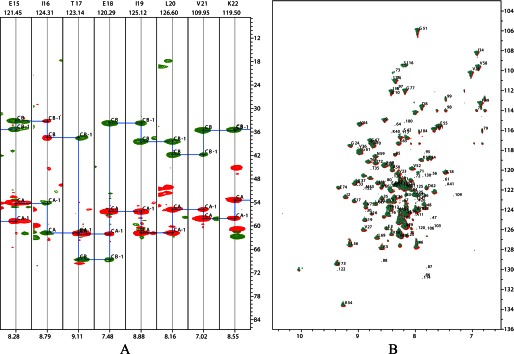
Representative NMR spectra of E2 didomain in the absence and presence of E3. A, plots displaying the strips from three-dimensional HNCACB for E2 didomain. B, overlaid two-dimensional 1H-15N TROSY HSQC spectra of E2 didomain (0.3 mm in red) with that of the E2 didomain-E3 subcomplex (0.3 mm of each protein in green) recorded at 25 °C in 20 mm sodium phosphate (pH 7.0) with 0.15 m NaCl.