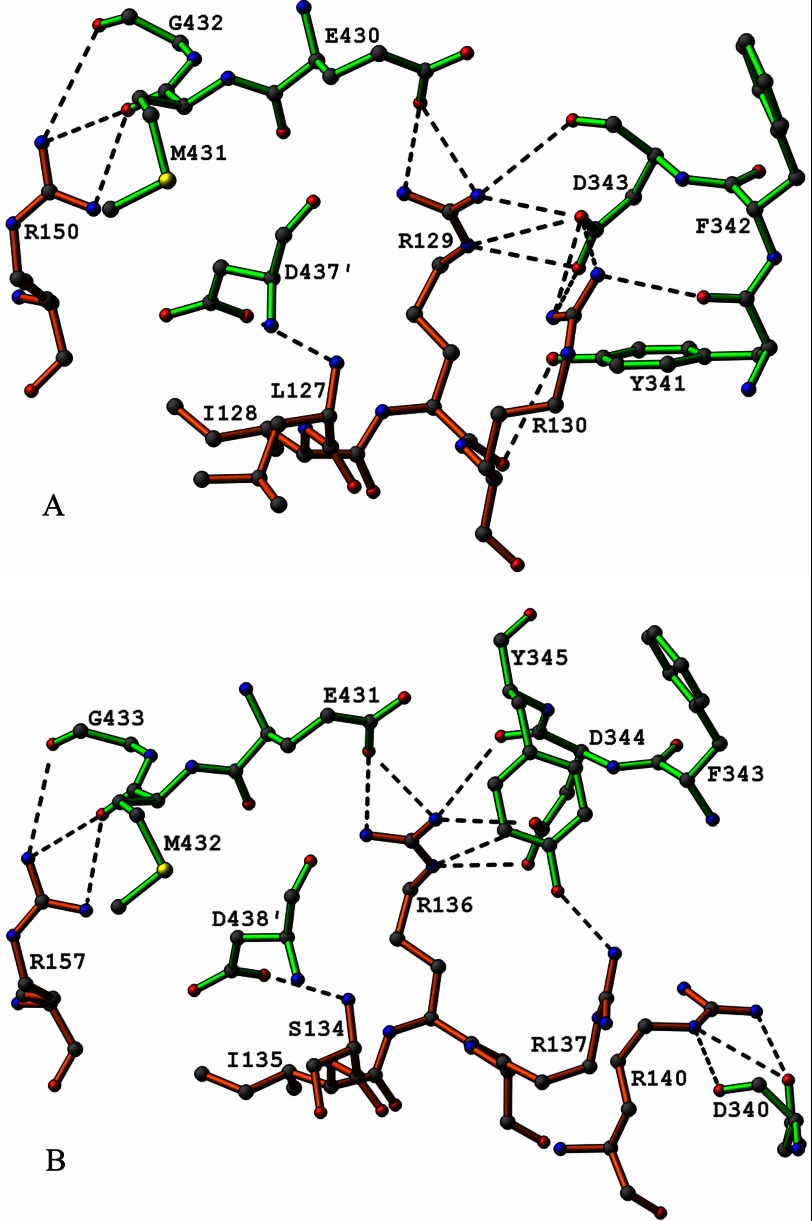
FIGURE 8.
A, diagram illustrating electrostatic binding interactions (≤3.5 Å) in the model of the E3-PSBD interface from E. coli. Bonds in residues from E3 are shown in green and those in residues from the PSBD in orange. Hydrogen bond and salt bridge contacts are indicated by dashed lines. This diagram is a model based on the crystal structure of the E3b-PSBDp complex from T. thermophilus described by Nakai et al. (33), with coordinates from the Protein Data Bank (PDB code 2EQ8). Please see text for details. B, diagram illustrating observed electrostatic binding interactions (≤3.5 Å) between the E3 and PSBD in the crystal structure of the E3b-PSBDp complex from T. thermophilus described by Nakai et al. (33), with coordinates from the Protein Data Bank (PDB code 2EQ8). Bonds in residues from E3 are shown in green and those in residues from the PSBD in orange. Hydrogen bond and salt bridge contacts are indicated by dashed lines.

