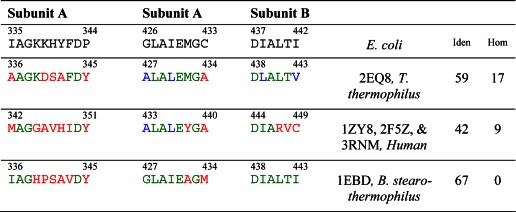
TABLE 7.
Sequences of the appropriate binding regions of the E3s
Residues at equivalent locations identical to those in E. coli E3 are shown in green, homologous residues in blue, and other residues in red. The last two columns indicate the percentage of residues identical with (Iden) or homologous to (Hom) those in E. coli.