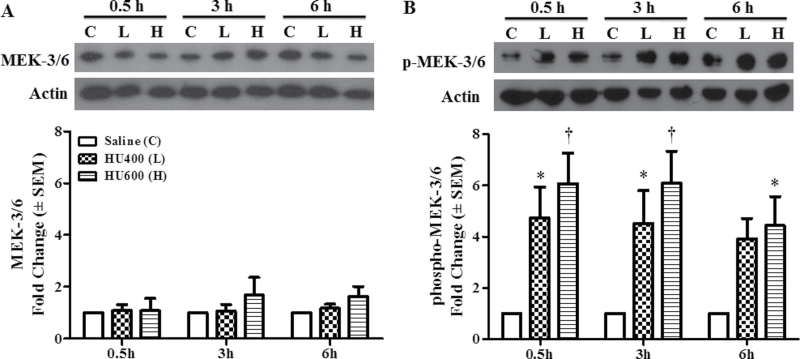
Fig. 1.
HU induced activation of MEK-3/6. (A) Western blot analysis of total protein expression of MEK 3/6 at 0.5, 3, and 6h after treatment with HU at 400mg/kg (L) or 600mg/kg (H) is shown in the upper panel. The lower panel shows the densitometry quantification of MEK 3/6. (B) Western blot analysis of phospho-MEK 3/6 at 0.5, 3, and 6h after treatment with HU at 400mg/kg (L) or 600mg/kg (H) is shown in the upper panel. The lower panel shows the densitometry quantification of phospho-MEK 3/6. There was a dose-dependent increase in phospho-MEK-3/6 at all time points. Each bar (mean ± SEM) represents embryos from five sets of pooled litters with two litters per pool (n = 5). * and †, significantly different from saline (control) group at the same time point (*p < 0.05; †p < 0.01, Dunnett’s test).

