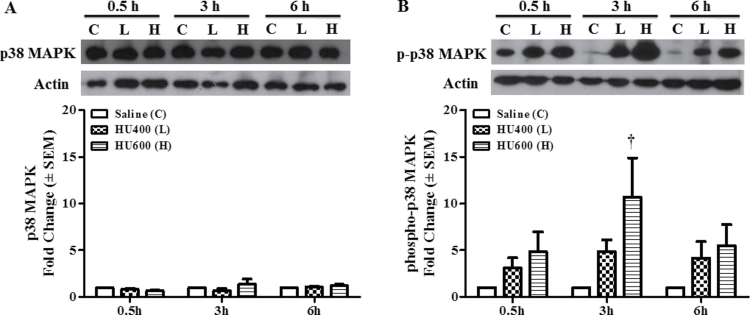
Fig. 4.
HU induced activation of p38 MAPK. (A) Western blot analysis of total protein expression of p38 MAPK at 0.5, 3, and 6h after treatment with HU at 400mg/kg (L) or 600mg/kg (H) is shown in the upper panel; the lower panel depicts the scan densitometry quantification of p38 MAPK. (B) Western blot analysis of phosphorylated p38 MAPK at 0.5, 3, and 6h after treatment with HU at 400mg/kg (L) or 600mg/kg (H) is shown in the upper panel; the lower panel depicts the scan densitometry quantification of phospho-p38 MAPK. Phospho-p38 MAPK expression was significantly different from control in embryos 3h after treatment with HU at 600mg/kg. Each bar (mean ± SEM) represents embryos from six sets of pooled litters, with two litters per pool. *, significantly different from saline (control) group at the same time point (†p < 0.01, Dunnett’s test).

