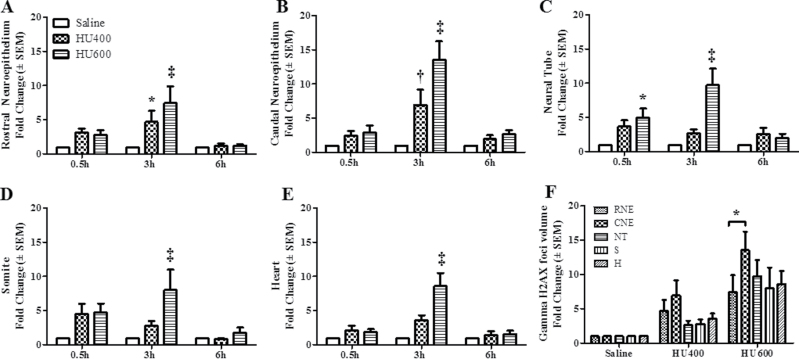
Fig. 9.
γH2AX focal volumes in different regions of GD9 embryos. The quantification of γH2AX focal volumes in different regions of the GD9 embryos exposed to saline or HU at 400 or 600mg/kg is presented for the RNE (A), CNE (B), NT (C), somite (D), and heart (E). Values were normalized to the corresponding saline controls and expressed as fold changes. n = 5. Asterisks, daggers, and double daggers denote a significant difference from saline controls at the same time point (*p < 0.05; †p < 0.01; ‡p < 0.001, Dunnett’s test). (F) The regional differences in γH2AX focal volumes found in the CNE of embryos exposed to HU at 600mg/kg. CNE was significantly different than RNE (*p < 0.05, Tukey’s multiple comparison test).

