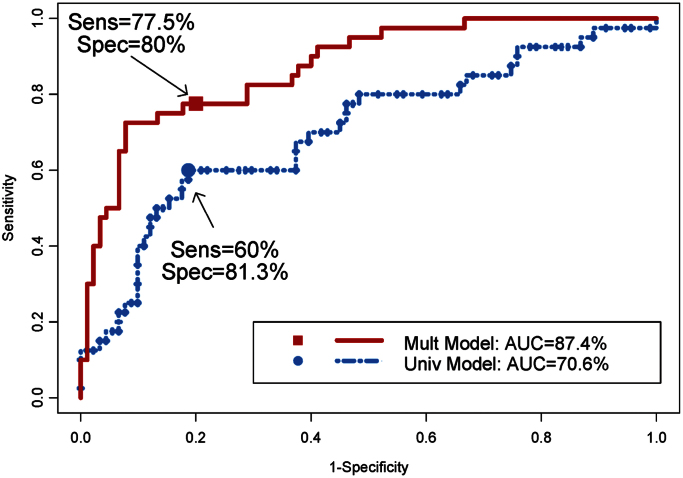
Fig. 1.
ROC curves of identifying DA+ (against DA− and asymptomatic) using IFN-γ promoter methylation status as a predictor. Univariate model: The ROC curve was estimated from a univariate logistical model using IFN-γ promoter methylation status as the only predictor. Multivariate model: The ROC curve was estimated from a multivariate logistical model using IFN-γ promoter methylation status as the predictor and DI exposed, smoking status, methacholine PC20 (mg/ml), and sex as controlling covariates. Cutoff points for derived sensitivities and specificities are provided in Table 4.

